Two Tests, Two Different Questions
Most people commissioning a solar survey arrive with a reasonable question. If a thermal survey already shows where the array is running hot, what does a separate electrical test add? It can sound like paying twice to be told the same thing. It is not, and the reason is worth understanding before choosing between a survey that does one and a survey that does both.
A thermal image and a string test answer different questions. Thermography finds where something is wrong: the panel, the cell, the junction box or the connector, located on the roof and photographed. String testing measures how badly: how much a string of panels is actually producing, how well its cabling is insulated, and what kind of behaviour is holding it back. One gives a location, the other gives a measurement, and a fault that leaves no heat behind it never appears on the first at all.
This post sets out what string testing is, what the I-V curve at the heart of it shows, and how its results are read with the thermal images rather than beside them. It ends with the one question worth asking before booking either, because on some systems the curve cannot be drawn at all.
Blog Content TL;DR...
A thermal survey and a string test are not two versions of the same check. They answer different questions.
- Thermography finds where energy is being lost as heat and places it on a specific panel, but it cannot measure output.
- String testing to IEC 62446-1 measures each string electrically, including its insulation resistance and an I-V curve across its whole working range.
- The shape of the curve indicates what kind of fault is present, not only that output is down.
- Some faults only the camera sees, such as a single failing cell, and others only the meter sees, such as insulation breaking down.
- Optimisers and micro-inverters limit what can be tested electrically, so the system’s make-up is settled before a survey is quoted.
One finds the problem, the other measures it, and read together they are worth more than either alone.
Where Versus How Much
A thermal image locates a problem, a string test measures it
What a thermal image records
A thermographic survey measures surface temperature across the array, and it is very good at one job: finding where energy is being lost as heat. A cell that has stopped converting sunlight, a connection carrying resistance it should not have, or a section of a panel that has been switched out of the circuit, each shows as a difference in temperature against its healthy neighbours, and each can be placed on a specific panel. What the camera reports is an observation consistent with an electrical condition. It cannot say how much power a string has lost, and it cannot see anything that does not change temperature.
What a string test measures
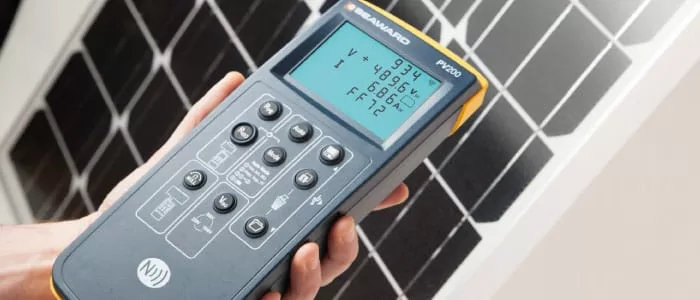
A string is a chain of panels wired one after another, so that their voltages add together before reaching the inverter. String testing to IEC 62446-1, the international standard for testing grid-connected solar systems, checks each chain electrically from ground level, at the inverter. It confirms the earth bonding is continuous, the polarity is the right way round, and the voltage and current are what the design says they should be. It also measures insulation resistance, which shows how well the cabling is still keeping electricity where it belongs, against the minimum the standard sets.
And then the curve
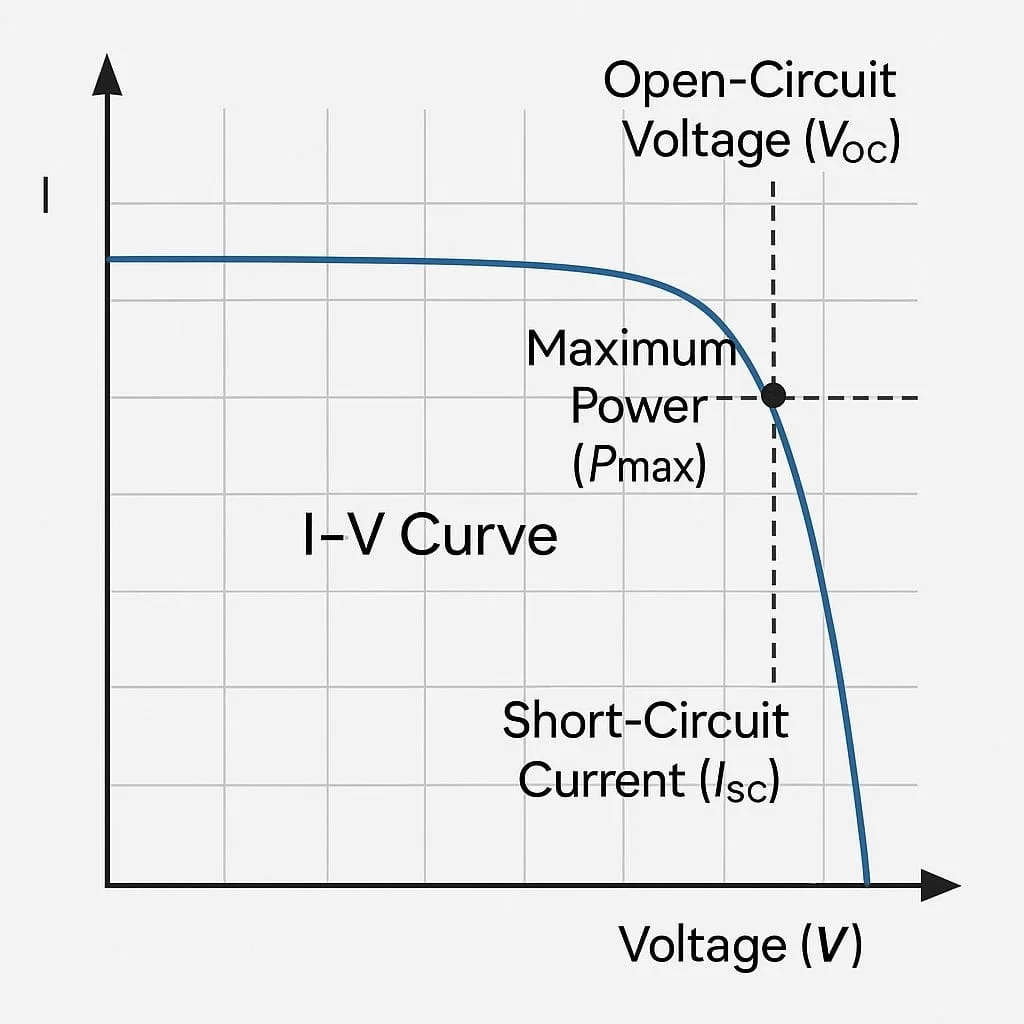
The last test is the one that says most. An I-V curve, current plotted against voltage, records how the string behaves across its whole working range rather than at a single point. The other tests ask whether the string is healthy. The curve shows what kind of trouble it is in.
Solar IV Curve Explained | What Does A Solar String Test Show | Fill Factor Solar ExplainedSolar IV Curve Explained | What Does A Solar String Test Show | Fill Factor Solar Explained
Reading the Curve Alongside the Image
When both see the same fault
Each panel is divided into sections, usually three, and each section is protected by a bypass diode, a small component that carries the current around that section when its cells cannot. On a thermal image a section that has been bypassed shows as an even band of warmth across part of the panel, with no cells at normal temperature inside it. The curve shows the same event as a step or a shortfall in voltage, because the string has lost some or all of that section’s contribution. The image says which panel, and the curve confirms the output has genuinely gone. Together they turn an interpretation into a finding.
When only the camera sees it
A single failing cell can run well above its neighbours and show clearly on a thermogram. Yet the bypass diode holds the string’s output up, so the curve may barely register it. That is why a thermal survey finds cell-level faults that an electrical test passes, and why those faults are judged on their temperature and their trend rather than on lost generation.
When only the meter sees it
The reverse is just as true. Insulation breaking down along a cable run produces no heat a camera can detect, yet a low insulation resistance reading is one of the clearest safety findings a survey can return. Added resistance spread along a string rounds and flattens the curve, and the fill factor, a single figure describing how close the curve comes to its ideal square shape, falls with it. A string can also lose current evenly across every panel, from soiling or age, without any one of them standing out thermally. None of these leaves anything for the camera to find.
Before You Book a Combined Survey
Ask what is fitted behind the panels
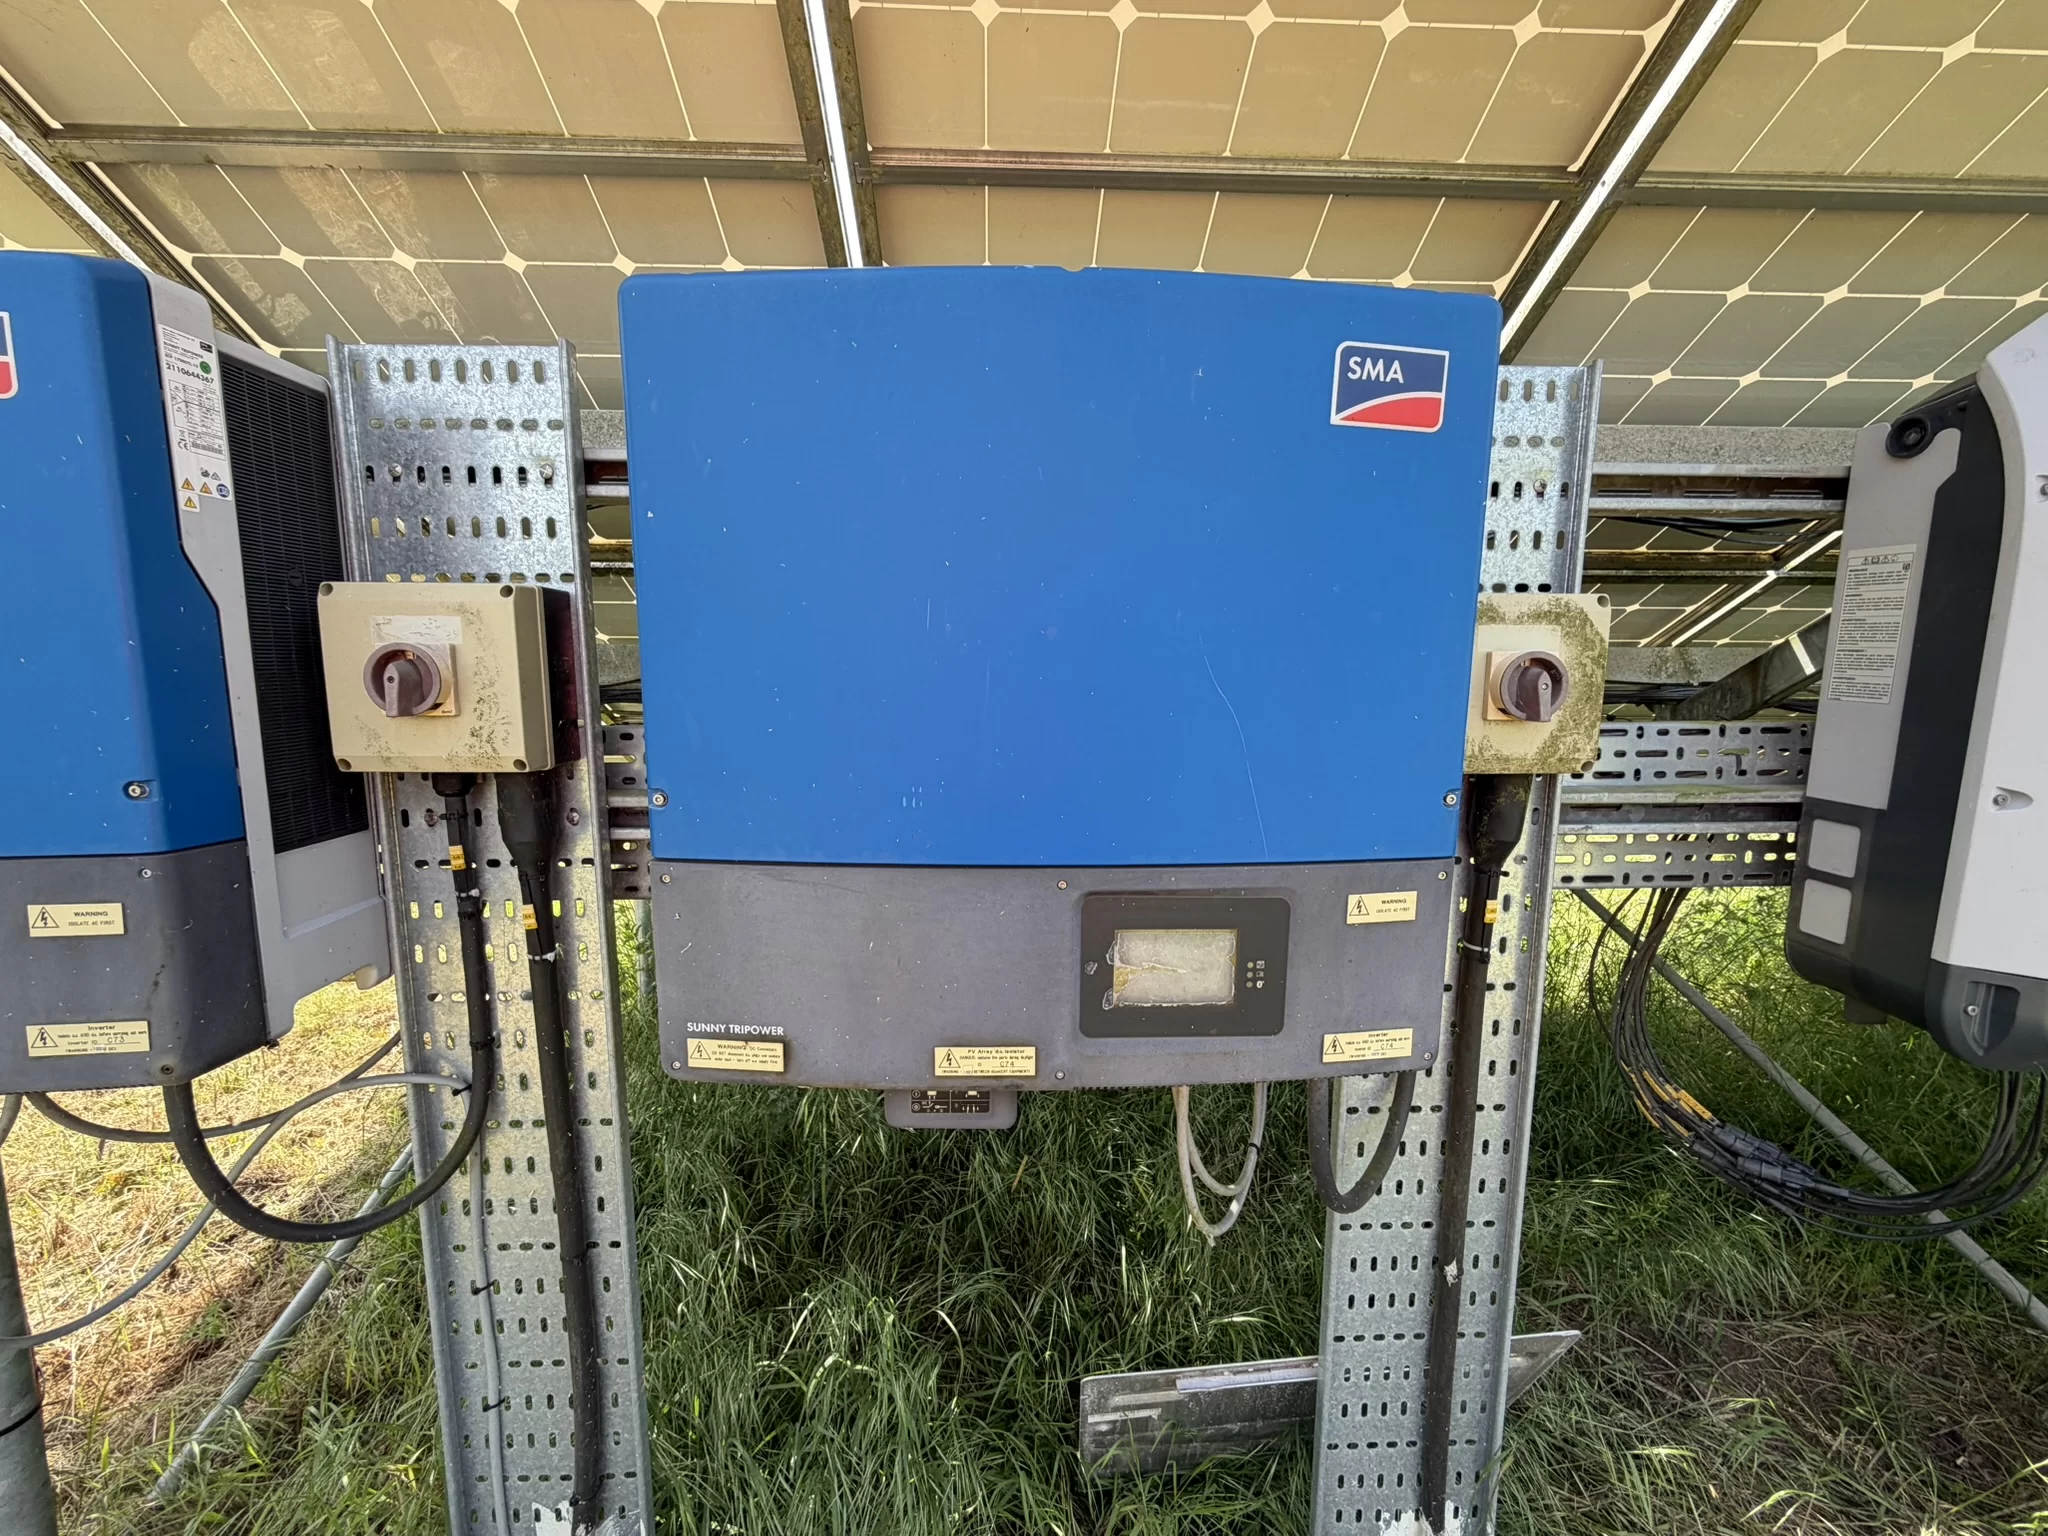
Many newer systems carry optimisers or micro-inverters, small electronic units fitted to each panel to manage its output individually. They change what can be measured. On an optimised string the curve cannot be drawn and a full-voltage insulation test must not be applied, because either would damage the electronics and return meaningless figures. The electrical scope reduces to earth continuity and polarity, and with micro-inverters there is no direct-current string at all, leaving earth continuity alone. The manufacturer’s own monitoring then stands in for part of the electrical picture, and the thermal survey carries more of the weight. Drone Media Imaging establishes how the system is built at enquiry, so the survey quoted is one the installation can actually support. What each design allows is set out in can every solar array be string tested?
Find the commissioning record
If the installer’s test results from handover still exist, each string can be measured against its own starting point. Where they do not, strings of the same design are compared with one another. That is a sound baseline but a different one, and the report states which was used.
One visit, one report
Carried out in the same visit, the two sets of results describe the array as it stood that day, and they are read together rather than reconciled afterwards. Few drone survey providers in the UK offer both side by side. The testing is string-level only, and every finding is reported as an area warranting further investigation by a suitably qualified contractor. The full scope is on our combined thermal and string testing page, within our wider solar PV surveys.
A curve tracer sweeps the string from open circuit, full voltage and no current, to short circuit, full current and no voltage, recording the points between. The two ends are read directly: the open-circuit voltage, written Voc, and the short-circuit current, written Isc. Between them sits the maximum power point, where voltage multiplied by current is greatest, recorded as Vmpp, Impp and Pmpp.
The fill factor divides that maximum power by Voc multiplied by Isc. A perfectly square curve would score 100%, and healthy crystalline modules in service typically sit between about 68% and 80%, depending on cell type. IEC 62446-1 sets no pass mark for it, so a low figure is a reason to look closer rather than a fault in itself.
Voltage also rises as cells cool, so open-circuit readings are corrected for cell temperature where it was measured, and otherwise compared only with strings tested in the same conditions. A warm afternoon can make a healthy string look a panel short.
Governing Standards
- IEC 62446-1:2016+A1:2018, the international standard for the documentation, commissioning tests and inspection of grid-connected PV systems, which sets out the string tests described here, including I-V curve measurement.
- IEC TS 62446-3:2017, the technical specification for outdoor infrared thermography of photovoltaic modules and plants.
- Analysis by Steve Fisher, ITC Level III Certified Master Thermographer (Infrared Training Centre; Certification #205722059), practising in accordance with the frameworks of ISO 18436-7:2014, ASNT SNT-TC-1A and ANSI/ASNT CP-105, and BINDT CMGEN Appendix B as UK training governance.
Arrange a Combined Solar Survey
Drone Media Imaging carries out combined solar PV thermal and string testing survey, analysis and reporting across Sussex, Hampshire, Kent and Surrey, travelling throughout the UK, Ireland and Europe. Tell us what is fitted behind the panels, if you know, and whether the commissioning test results still exist, and we will confirm what your system can support and quote the survey against it.
related posts

A roof gets inspected in the places a person could stand, and that single fact explains most of what gets found late. Ladders reach the eaves, scaffolds cover one elevation, and fragile coverings restrict a roof walk exactly where the roof is oldest. Photographing from the air removes the constraint rather than the expertise: every slope is covered square on, and the interpretation stays with your roofer or surveyor.

The instinct on an inspection is to move in close. On most sites that is the least useful thing the pilot can do, because proximity puts the platform among the hazards and changes the surface being measured. Standoff inverts the trade, letting the optics close the gap instead. This piece sets out what standoff buys on a working site, what actually governs the working distance, and where the limits sit, including why a thermal measurement is never a zoomed view.

Conducting an IEC inspection at Trethosa, Cornwall's solar farm for Natural Generation Ltd.Drone Media Imaging examined the solar panels in line with IEC 62446-3:2017 to ensure compliance with safety standards, ensuring optimal performance and longevity of the solar farm.