Quantitative vs Qualitative Thermography Explained
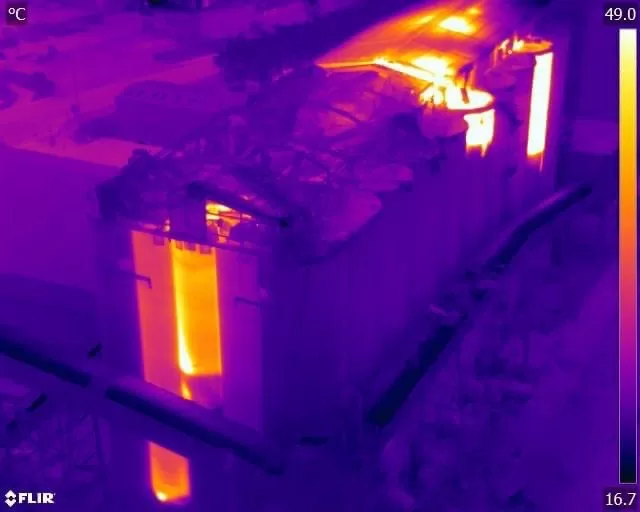
Quantitative thermography measures actual temperatures. Qualitative thermography reads thermal patterns without assigning values to them. Both are legitimate, both are used daily in professional survey work, and the difference between them decides what a report can and cannot conclude.
The useful question is not which method is better. It is what the survey has to prove, and whether the person interpreting the data is qualified to make that judgement.
That matters more than it first sounds. A thermal image showing a warm patch is not evidence of a fault, and a temperature reading taken without correcting for emissivity and reflected apparent temperature is not evidence of very much at all. Disputed thermal surveys almost always fail at this point, on what the data was allowed to prove rather than on what the camera saw.
What follows sets out what each method actually measures, where each is the right choice, and how a competent survey uses the two together. If you are commissioning a thermal survey and want to understand what you are being sold, this is the distinction to start with.
Blog Content TL;DR...
At a Glance
Quantitative and qualitative thermography answer different questions, and the difference decides what a survey report can conclude.
- Quantitative thermography measures corrected surface temperatures and produces numbers that can be classified, compared and defended.
- Qualitative thermography identifies faults from thermal pattern, shape and contrast, without assigning temperature values.
- Corrections for emissivity, reflected apparent temperature, distance and atmosphere are what separate a measurement from an apparent reading.
- Qualitative work is not the easier option. Most misdiagnosis comes from reading a pattern without knowing what else can produce it.
- Most professional surveys use both, a qualitative sweep to locate anomalies and quantitative measurement to classify the ones that matter.
- IEC 62446-3 states that training on the infrared camera provided by its manufacturer is not sufficient for this work.
The camera captures the data. The thermographer decides what it means.
Quantitative Thermography: Measuring Actual Temperatures
Quantitative thermography produces numbers. The thermographer measures surface temperature at defined points and corrects the reading for the conditions that affect it, principally emissivity, reflected apparent temperature, distance and atmospheric effects. Without those corrections a thermal camera reports apparent temperature, which is not the same thing as the temperature of the object.
Numbers make comparison possible. A measured difference between a suspect component and a healthy reference can be classified against a severity threshold, tracked across repeat surveys, and defended if it is challenged. That is why quantitative analysis underpins electrical condition monitoring, solar PV fault classification, and any survey that has to support a decision to spend money.
It is also the harder discipline, because every correction the thermographer applies is a judgement that changes the result.
Qualitative Thermography: Reading the Pattern
Qualitative thermography identifies anomalies by their shape, distribution and contrast rather than by their measured value. A cold bridge, a run of missing insulation, moisture spreading through a flat roof and a bypass diode fault in a solar string all have recognisable thermal signatures, and none of them needs a temperature to be identified.
It is a common misconception that this makes qualitative work the easy option. It does not. Interpreting a pattern correctly means knowing what else could produce the same signature, and that is where most misdiagnosis happens: reflection mistaken for heat, thermal mass mistaken for a fault, a shadow mistaken for moisture. IEC 62446-3 addresses the point directly, stating that training on the infrared camera provided by its manufacturer is not sufficient.
Qualitative analysis answers a different question, not an easier one.
Which Approach Does Your Survey Need?
In practice most professional surveys use both. A qualitative sweep locates the anomalies, then quantitative measurement is applied to the ones that matter so they can be classified and prioritised. A survey that only does the first half gives you a set of interesting pictures. A survey that only does the second half measures whatever the operator happened to point at.
The distinction that matters commercially is not between the two methods. It is between capture and interpretation. Flying a drone with a radiometric sensor is a capture task, and a competent pilot can be trained to do it. Deciding what the resulting thermal data means, and being able to defend that conclusion, is an analysis task carried out against a recognised framework.
So when you commission a thermal survey, the question worth asking is not what camera will be used. It is who will read the results, and what they are qualified to conclude.
Have Your Thermal Survey Read at Level 3
Drone Media Imaging delivers aerial thermographic survey, analysis and reporting for solar PV, buildings, roofs and industrial assets, with analysis by our ITC Level III Certified Master Thermographer. We work across Sussex, Hampshire, Kent and Surrey and travel throughout the UK, Ireland and Europe. Tell us what needs surveying and we will scope it properly.
related posts
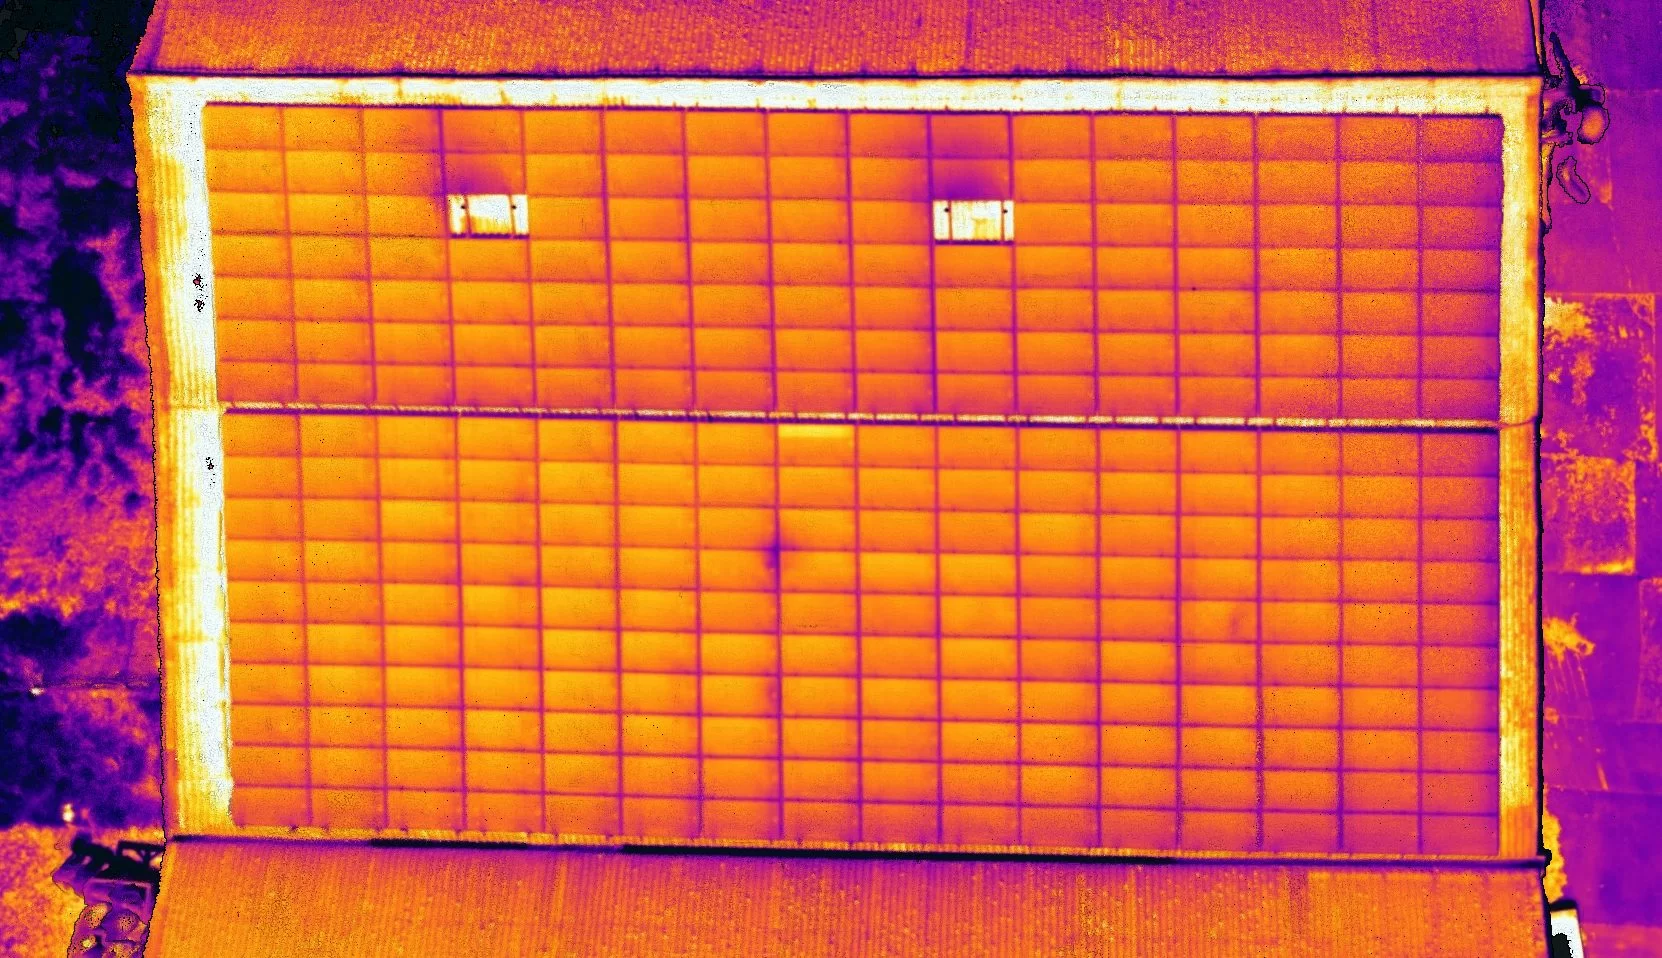
An aerial thermal survey records a temperature difference, and that difference has to exist when the image is taken. Conditions are therefore not a preference but a precondition, and different assets want opposite weather: a photovoltaic array needs bright, stable sun, a building envelope needs a cold night after dark. This piece sets out what the standards ask for, why each figure exists, and what booking against a window rather than a date means in practice.

The air a survey drone works in is shared. Air ambulances, police helicopters, light aircraft, infrastructure inspection flights and military low flying training all have legitimate business below 120m, and none of them knows a drone is there unless somebody says so. This piece explains how a commercial operator builds the low level picture before a flight, what the United Kingdom Low Flying System is, how notification works and what it does not buy, and the small decisions on site that keep a survey and a passing aircraft apart.
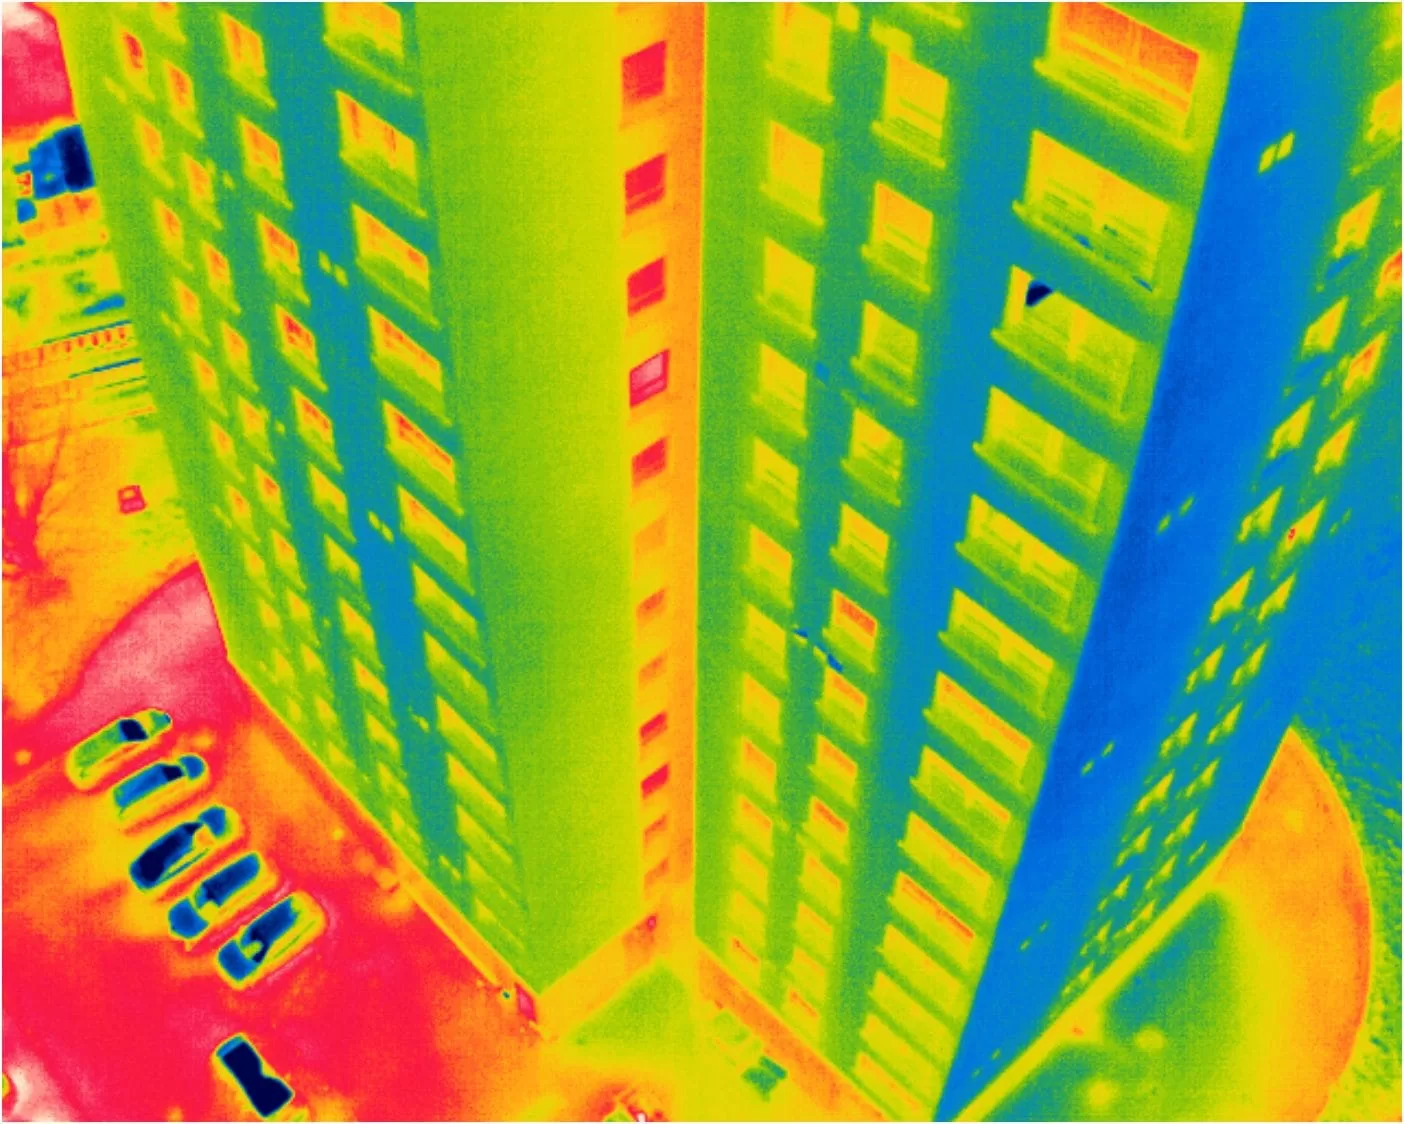
A drone operator in Scotland flew three multi-storey residential blocks in the spring of 2025. They had the aircraft, the payload and the access, but nobody able to sign the result as a certified thermographic inspection. We wrote the capture protocol for their team before the flight and certified the reporting afterwards. This piece covers why the protocol comes first, what the analysis established, and what remote reporting genuinely cannot settle.