Blog Content TL;DR...
Savings in Every Snapshot: How Building Thermography Reduces Energy Costs

Understanding the Concept of Building Thermography
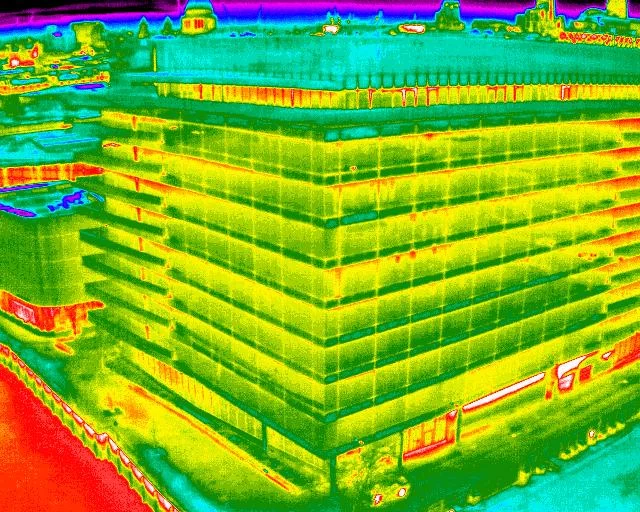
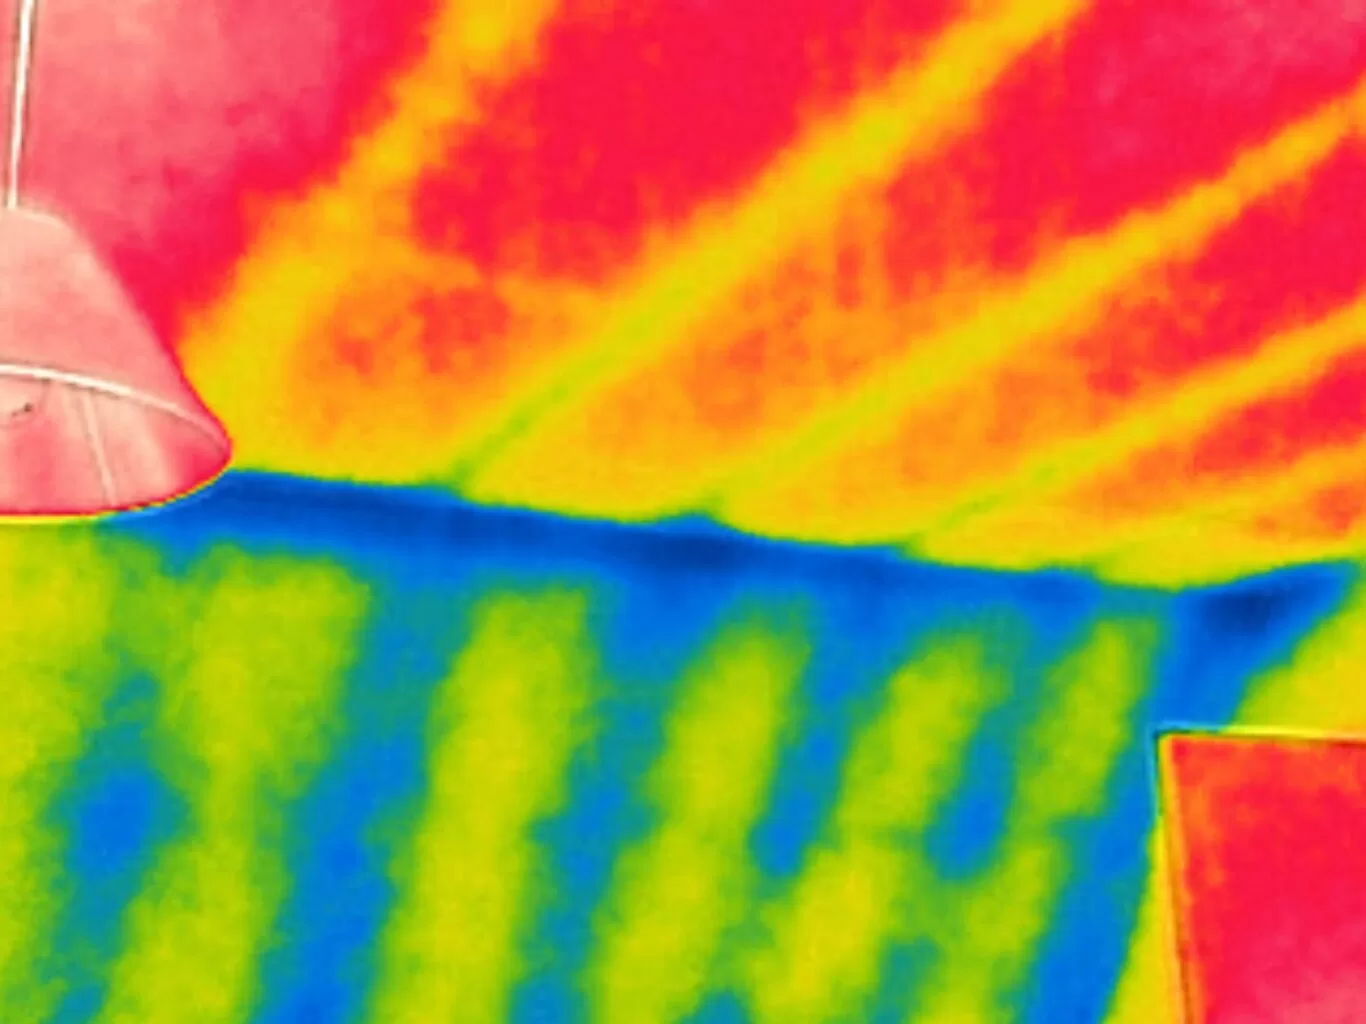
Building thermography, also known as thermal imaging, is a non-invasive method of identifying energy inefficiencies in a building. It uses infrared technology to detect heat loss or gain, moisture intrusion, and other anomalies that can affect a building’s energy performance. The process involves capturing thermal images of a building, which are then analysed to identify areas of energy inefficiency.
The beauty of building thermography is that it provides a visual representation of energy loss, making it easier to pinpoint problem areas. It’s like having x-ray vision for your building’s energy performance. According to the Energy Saving Trust, a UK-based organisation dedicated to promoting energy efficiency, “Thermal imaging can help identify a range of issues including missing insulation, thermal bridges, and air leakage.”
The Role of Thermography in Energy Conservation
Thermography plays a crucial role in energy conservation. It provides a clear picture of where energy is being wasted, allowing for targeted improvements. The UK’s Department of Energy and Climate Change states, “Thermal imaging can help identify areas where energy is being wasted, making it a valuable tool in the drive to reduce energy consumption and carbon emissions.”
By identifying areas of energy inefficiency, building thermography enables building owners and managers to make informed decisions about where to invest in energy-saving measures. This could include anything from installing insulation to sealing air leaks. The result is a more energy-efficient building that not only reduces carbon emissions but also saves money on energy bills.
Practical Applications of Building Thermography in Reducing Energy Costs
Building thermography has a wide range of practical applications in reducing energy costs. For example, it can be used to identify areas of poor insulation, which can then be addressed to reduce heat loss. It can also detect thermal bridges – areas of a building where heat is transferred at a higher rate than surrounding areas. By addressing these issues, building owners can significantly reduce their energy costs.
In addition, building thermography can identify air leaks, which can be a major source of energy loss. According to the UK’s National Energy Foundation, “Air leakage can account for up to 30% of the heat loss from a building.” By identifying and sealing these leaks, building owners can make significant energy savings.
Case Studies: Real-Life Examples of Savings through Building Thermography
There are numerous real-life examples of how building thermography has resulted in significant energy savings. For instance, a case study by the UK’s Carbon Trust found that a company was able to reduce its energy costs by 20% after implementing energy-saving measures identified through thermal imaging.
Another case study, published by the Energy Saving Trust, found that a homeowner was able to reduce their energy bills by £250 a year after addressing issues identified through a thermal imaging survey. These case studies demonstrate the significant savings that can be achieved through building thermography.
Building Surveys using Thermography
Want to reduce your energy costs and carbon footprint? Discover the power of building thermography. Contact us today for a thermal imaging survey and start saving on your energy bills.
We are experienced and certified level 3 category thermographers. We work both from the air using specialist thermal drone technology as well as on the ground using traditional building thermal imaging techiques to inspect commericla and domestic properties. Thermography is a non-destructive and non-invasive technology looking at the anomolies, faults and observations covering moisture, water ingress, insulation continuity, heat loss, air leakage, thermal bridging and insect infiltration.
related posts
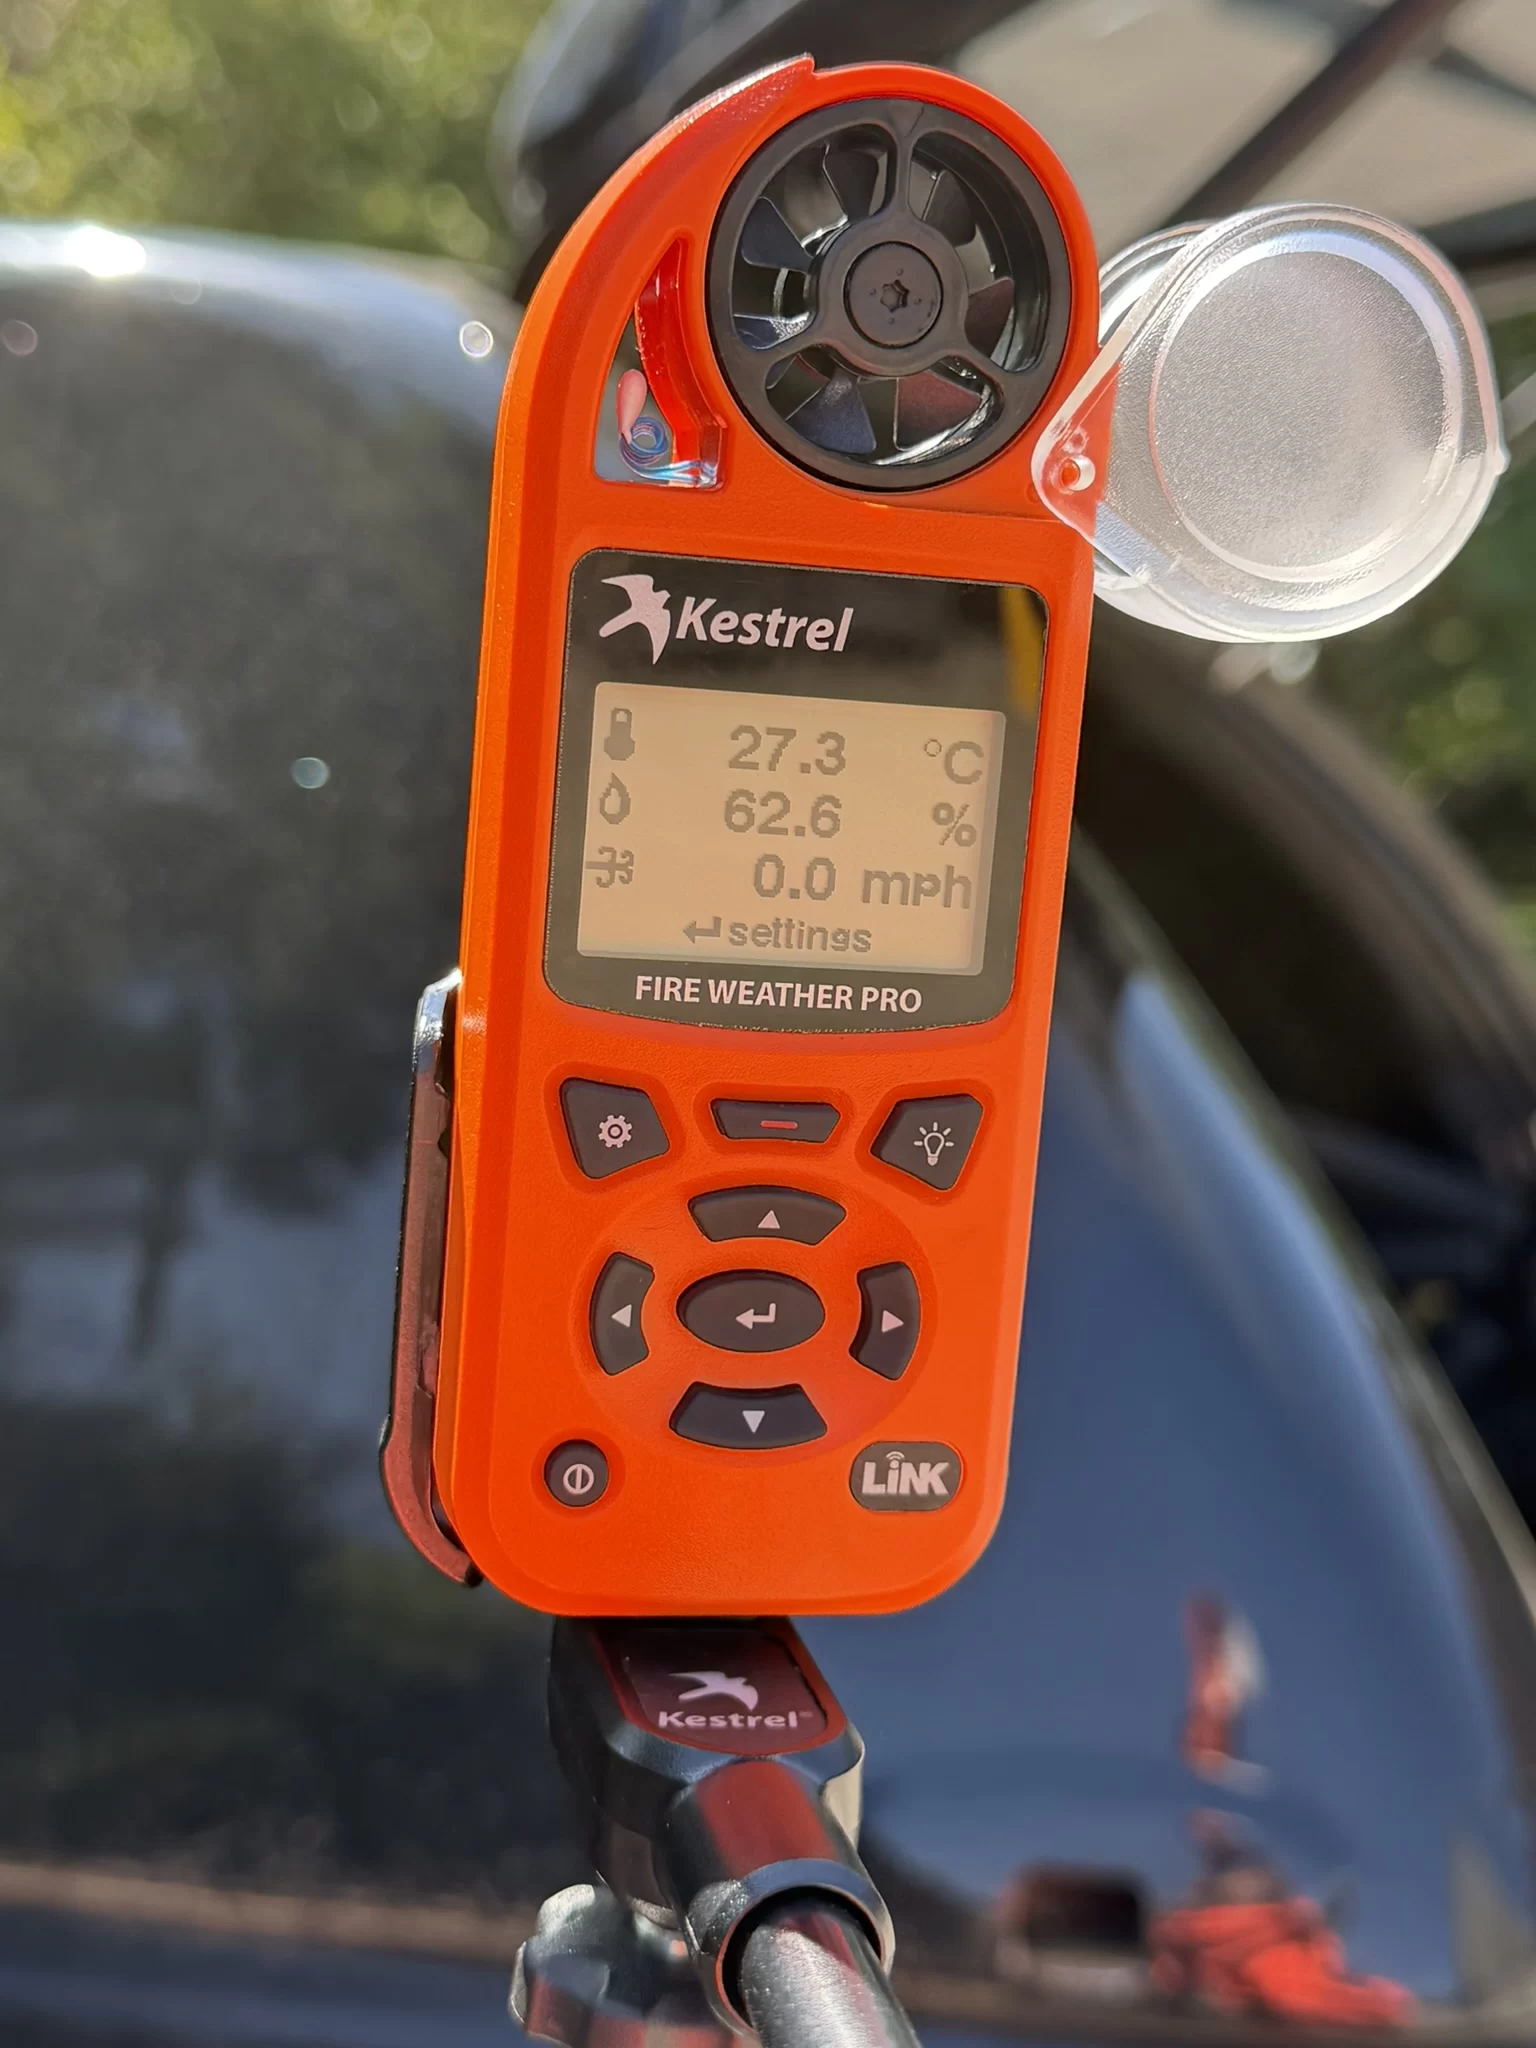
The dew point is the temperature at which air saturates and water condenses onto a surface. The cold, clear, still nights that suit building thermography are the same nights that drive roofs below it, and a roof carrying dew shows the camera a film of water rather than its own temperature pattern. This article explains what the dew point is, what condensation does to a thermal image, and how an aerial survey is timed so the building is read while it is dry.

Engaging a Level 3 Master Thermographer delivers precision, regulatory confidence and tailored solutions that generic inspections cannot match. From interpreting subtle thermal anomalies to producing professionally verified reports, a Level 3 expert ensures your thermal imaging supports maintenance decisions, compliance and cost savings. This advanced level of thermographic expertise benefits sectors such as construction, energy and manufacturing by reducing risk, avoiding costly failures and aligning with standards like ISO 18436 and BS EN 13187. Trust certified mastery for reliable diagnostics and actionable insights.

Ask what temperature difference proves a roof is wet and you will be given a number. It is the wrong answer to the wrong question. A thermal camera measures surface temperature, arrived at through emissivity, reflection and viewing angle, and what identifies trapped moisture is behaviour over time rather than magnitude. This post covers what the camera is really reading, why saturated material lags behind dry material as a roof cools, and the conditions that decide the result before anyone flies.