
The dew point decides when a building can be read from the air
The dew point is the temperature at which the air around a surface can no longer hold the water vapour it carries. Cool a surface below it and water condenses onto that surface as dew, or as frost when the surface is below freezing. It is fixed by how much moisture the air actually holds, not by how warm the air happens to be, which is why a humid evening can put water on a roof long before the air itself feels cold.
For building thermography that matters more than it first appears. The conditions a survey needs, a cold night, a clear sky and still air, are the same conditions that drive exposed surfaces below the dew point. A roof or a facade that has started to collect condensation is no longer showing the camera its own temperature pattern. It is showing a film of water, releasing heat as it forms and taking heat away as it evaporates.
This article explains what the dew point is, what condensation does to a thermal image, and how an aerial survey is planned so that the data is gathered while the building is still dry. How a whole-envelope survey runs in practice is set out on our building heat loss survey page.
Blog Content TL;DR...
What the dew point means for an aerial thermal survey of a building.
- The dew point is set by how much moisture the air holds, and condensation forms on any surface cooled below it.
- On a clear night, roofs radiate heat to the sky and fall below the air temperature, so they reach the dew point first.
- Once dew forms, the camera reads a film of water, and the heat released by condensing water compresses the contrast a survey relies on.
- Drying at dawn or in a breeze paints its own pattern, which can look like a defect without the environmental record beside it.
- Air temperature, humidity and dew point are measured on site, and a survey is timed, or postponed, so the building is read while it is dry.
The nights that suit thermography are the nights that make buildings wet, so the dew point is planned for, not left to chance.
What the Dew Point Is, and Why Roofs Reach It First
A clear night sky cools a roof faster than it cools the air
Moisture content, not temperature, sets the dew point
Air at any temperature carries some water vapour, and warmer air can carry more of it before it saturates. Relative humidity describes how close the air is to that limit at its present temperature, so it rises as the evening cools even though no moisture has been added. The dew point describes the same air differently. It is the temperature at which that air would be saturated, and it holds steady for as long as the moisture content does. That makes it the more useful figure on site, because it can be compared directly with the temperature of a surface.
Surfaces reach it before the air does
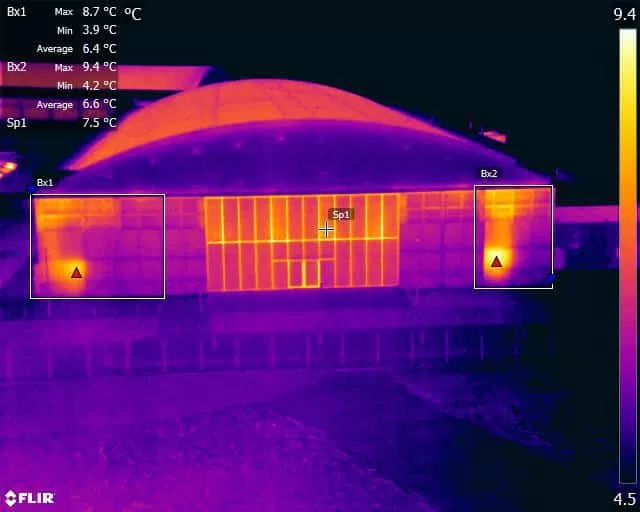
Condensation forms on a surface whose temperature falls below the dew point of the air touching it. On a clear night an exposed roof loses heat by radiation to the sky, which behaves as a far colder body than the air at ground level, and a roof covering routinely falls below the surrounding air temperature as a result. Pitched and flat roofs see the most sky and cool hardest, followed by the upper parts of walls and then the sheltered lower elevations. Cloud reduces the effect and wind stirs warmer air across the surface, which is why a still, clear, humid night is the one on which roofs are most likely to be wet by dawn.
A well insulated roof reaches the dew point first, because less heat arrives at its outer surface from the rooms below. Areas losing more heat stay warmer and drier for longer. That is why frost sometimes lies in a pattern that mirrors the insulation beneath it.
what the dew point means for a thermal survey, why dew on a roof hides heat loss, how humidity decides an aerial survey windowwhat the dew point means for a thermal survey, why dew on a roof hides heat loss, how humidity decides an aerial survey window
What Condensation Does to a Thermal Image
The camera reads the water, not the roof
A thermal camera measures the radiation leaving the outermost layer of whatever it is pointed at. Once dew has formed, that outermost layer is a film of water rather than the tile, membrane, slate or render beneath it. Water has its own emissivity, different from that of many roofing and facade materials, and a wet surface reflects more of its surroundings, including a cold clear sky. The radiometric corrections set for the dry material no longer describe the surface in frame, so the apparent temperatures recorded across a wet roof cannot be read as if it were dry.
Condensation flattens the contrast a survey needs
Water releases heat as it condenses. A surface collecting dew is warmed slightly by that process, which tends to hold it close to the dew point rather than letting it fall further. Across a roof that is condensing everywhere, the colder, better insulated areas are held up and the differences a survey relies on are compressed. The pattern of heat loss is still there in principle, but it has been pressed into a narrower band and partly overwritten by a process that has nothing to do with the building fabric.
Evaporation paints a second, misleading pattern
The reverse happens as conditions change. When the air dries, the wind rises or the first light reaches the roof, the dew begins to evaporate, and evaporation draws heat away from the surface. It does not do so evenly. Exposed ridges, edges and surfaces in moving air dry first, sheltered areas and hollows dry last, and a thermogram taken during that period records the drying pattern as cold and warm areas. Read without its context, drying can look very like a defect, which is why the environmental record matters as much as the imagery.
How an Aerial Survey Is Planned Around the Dew Point
Measure the air before the building
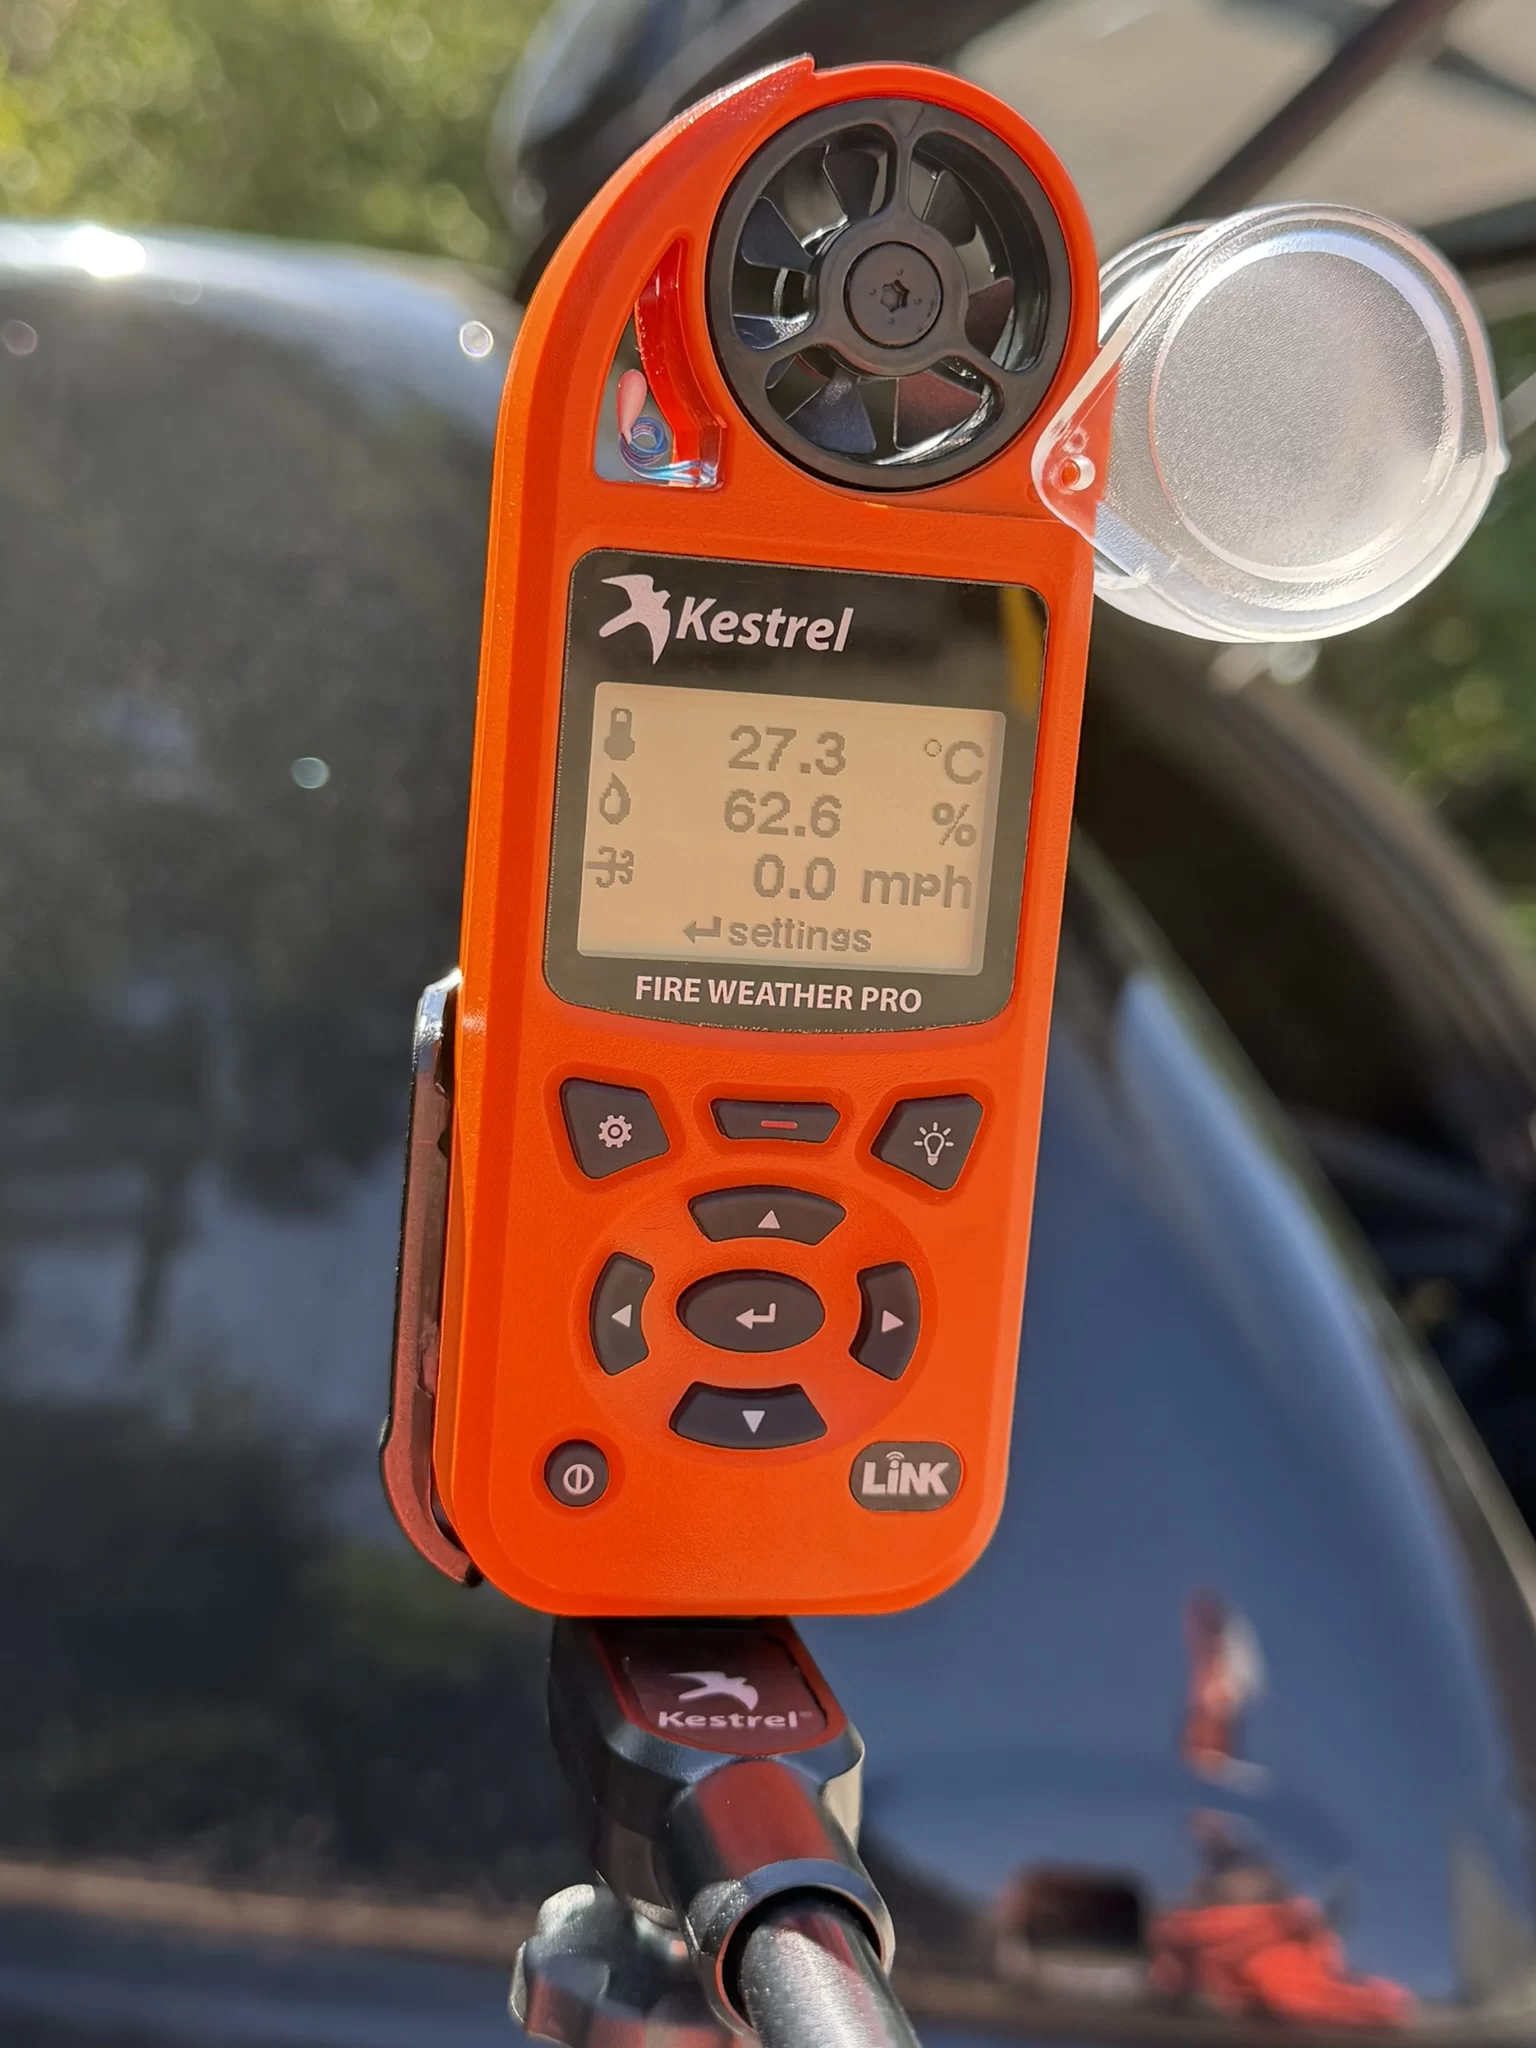
Every survey starts with an environmental reading at the site: air temperature, relative humidity and the dew point that follows from them, taken with a calibrated meter and repeated through the flight. The gap between the air temperature and the dew point, often called the dew point spread, is the working indicator. A wide spread leaves exposed surfaces room to cool without reaching saturation. A narrow one, closing as the night goes on, warns that roofs will start to condense before the survey is finished. The same readings feed the atmospheric correction, since humid air between the aircraft and the building also attenuates what reaches the camera.
Choose the window, and be prepared to stop
Where the forecast shows the spread closing overnight, the capture is planned for the part of the night when the building has settled but its surfaces are still dry, rather than for the coldest hour before dawn. Our working protocols treat mist on the surfaces, wet surfaces and humidity approaching saturation as grounds to postpone, and the aircraft and camera are acclimatised outside before the first frame so that the lens does not mist in cold, damp air. A survey called off on the night costs a return visit. A survey flown through condensation costs a dataset that looks complete and cannot be relied on.
Reported as observed, under stated conditions
The conditions recorded are carried into the report alongside the findings, because a result is only valid for the conditions it was captured in. Where part of a building had begun to condense, those frames are marked as descriptive only. Findings are presented as areas warranting further investigation by a suitably qualified contractor, as part of a survey, analysis and reporting service.

The environmental meter records air temperature and relative humidity at the start of the survey and at intervals through it, and the dew point is derived from those two values rather than estimated. Wind speed and cloud cover are logged alongside, because both change how quickly exposed surfaces cool towards saturation. Air temperature and humidity are entered into the camera’s atmospheric correction, and the distance to the surface is set from the flight height, since a longer path through humid air attenuates more of the signal. Reflected apparent temperature is taken from sky and reference frames captured on the night, in line with ISO 18434-1:2008, and is never assumed from a default. During analysis, surface temperatures read from the thermograms are compared against the logged dew point for the time each frame was captured. Frames in which a surface sits at or close to the dew point, or in which visible condensation or drying is recorded, are flagged as descriptive only and are not used to draw conclusions about the fabric.
Governing Standards and Certification
- Thermographic inspection, analysis and reporting conducted by Steve Fisher, ITC Level III Certified Master Thermographer (Infrared Training Centre; Certification #205722059).
- Practising in accordance with the frameworks of ISO 18436-7:2014, ASNT SNT-TC-1A and ANSI/ASNT CP-105, and BINDT CMGEN Appendix B (UK training governance).
- Building envelope methodology aligned with BS EN ISO 6781-1:2023 as applicable.
- Reflected apparent temperature determined and compensated in accordance with ISO 18434-1:2008.
- Findings are reported as areas warranting further investigation by a suitably qualified contractor, and no remedial or corrective work is offered or implied.
Plan an Aerial Thermal Survey of Your Building
Drone Media Imaging provides survey, analysis and reporting for aerial thermal surveys of buildings and roofs across Sussex, Hampshire, Kent and Surrey, travelling throughout the UK, Ireland and Europe, with thermography undertaken worldwide. If you are planning a survey this season, it is worth talking through the building, the heating and the likely weather before a date is fixed.
related posts
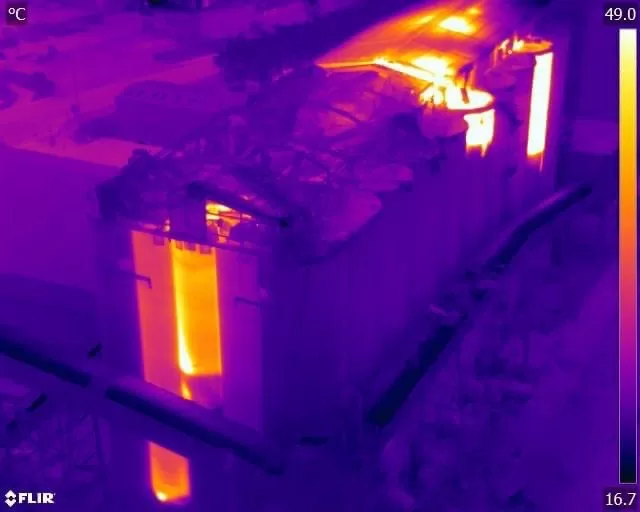
Quantitative thermography measures corrected surface temperatures and produces defensible numbers. Qualitative thermography identifies faults from thermal pattern and contrast without assigning values. Neither is the easy option, and most professional surveys use both: a qualitative sweep to find the anomalies, then quantitative measurement to classify the ones that matter. The distinction that counts commercially is not the method but who interprets the data, and what they are qualified to conclude. Drone Media Imaging analyses at ITC Level III.

A construction project always has more people with a stake in it than it can have standing on the site. An aerial record shows the whole plot in one frame, with the boundary, the compound, the access and the works in their correct relationship, so people who cannot get there still understand it. This piece covers that use, what flying over a live workplace actually involves, and where a visual record stops and measurement begins.
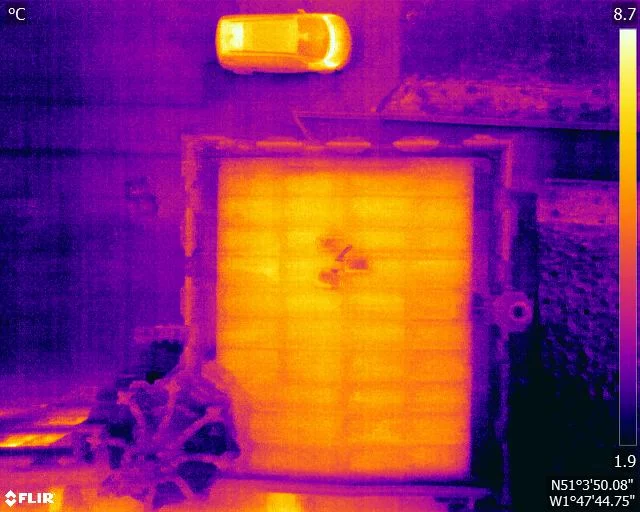
A flat roof is a build-up of layers, and water in the insulation changes how that part of the roof stores and releases heat. It does not make water visible to a thermal camera. What it creates is a lag, a wet zone that cools more slowly than the dry roof around it once the sun has gone. This is how that lag is produced, why the survey is timed to it, and what a warm patch is honestly worth.