
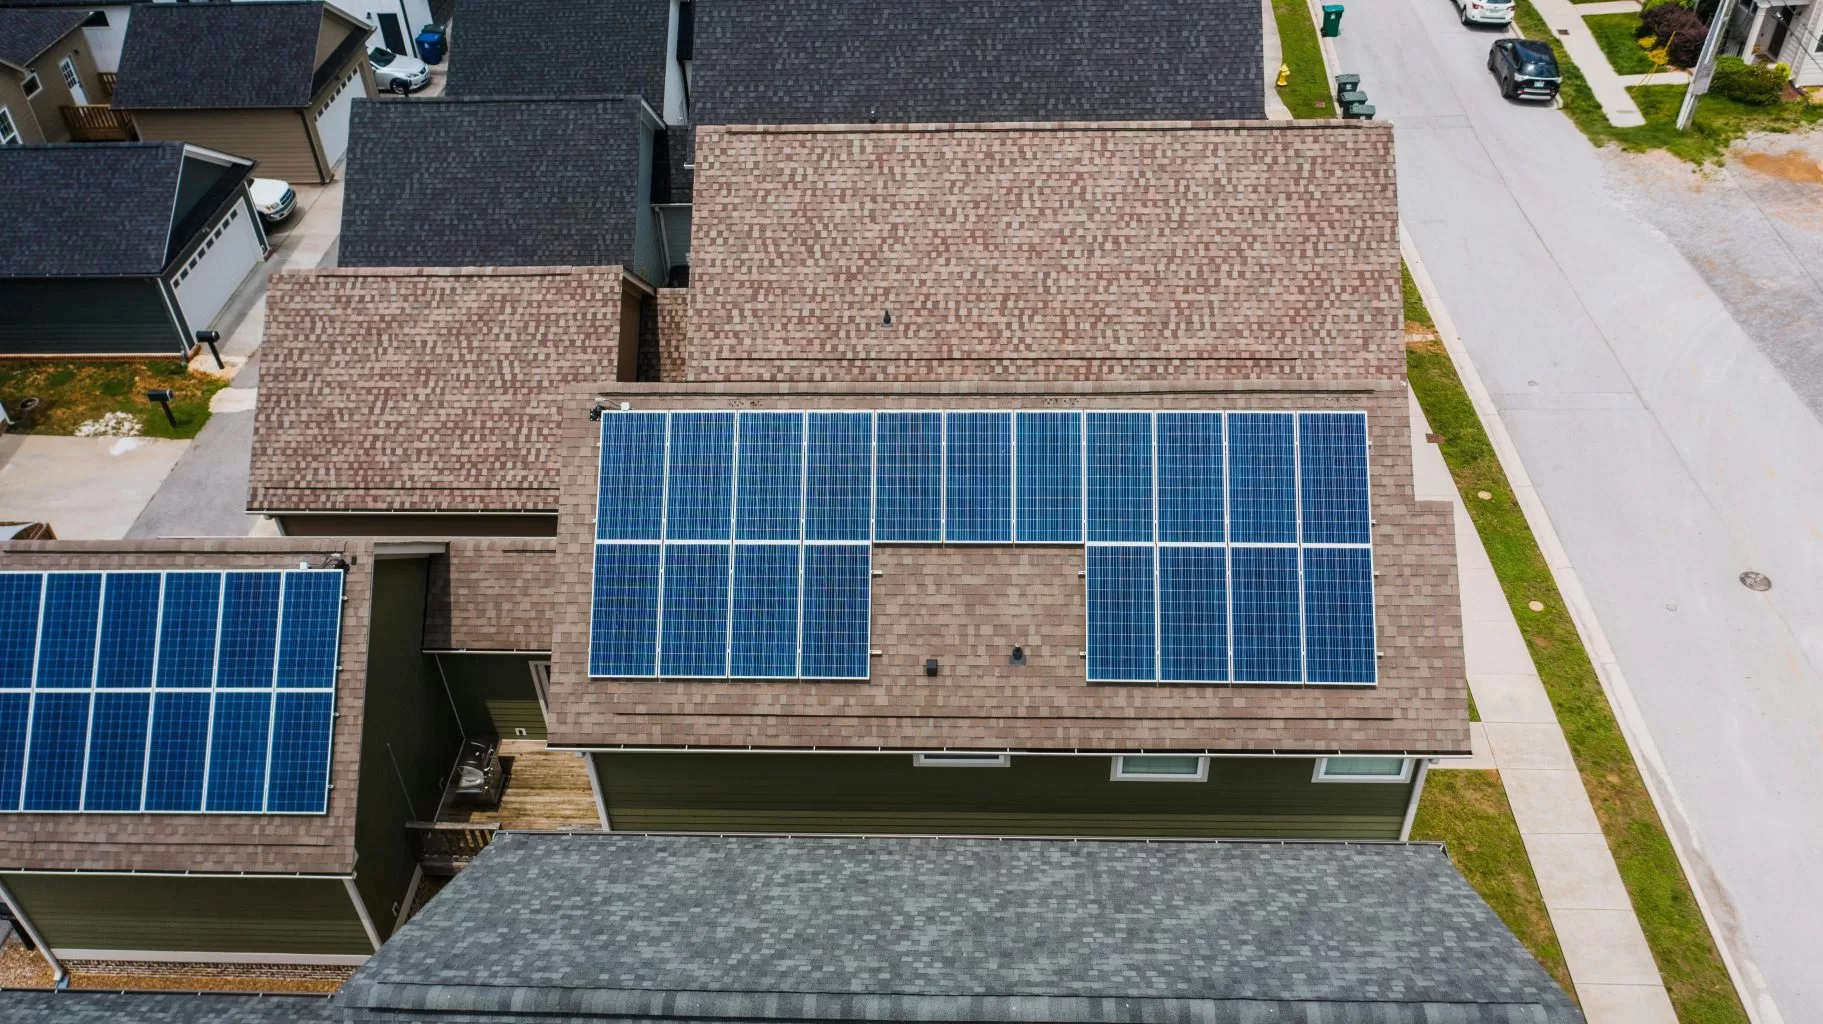
Solar Panel Performance Over Time
A solar array is one of the few things a household buys and then forgets about. It has no moving parts, it makes no noise, and it sits on a roof nobody looks at. When something begins to go wrong, nothing rings, nothing smells and nothing stops. The array carries on generating, just slightly less than it should, and the shortfall hides inside the ordinary week to week variation of British weather.
That is the honest problem with a domestic system, and it is not really a technical problem at all. It is a visibility problem. The owner is asked to judge the condition of an asset they cannot see, using a single number that was never designed to tell them about condition.
This piece looks at what happens to a residential array across its working life, why a developing fault on a roof is usually silent, and what the generation figures an owner can actually see do and do not tell them. It also sets out where an independent look at the array itself fits, and what that look can reasonably be expected to find. A well built array is a long lived asset and most of them do exactly what was asked of them for a long time. The point is narrower than that, and it is simply this: absence of evidence is not evidence of absence, and on a domestic roof the absence of evidence is the normal condition.
Blog Content TL;DR...
What a homeowner can reasonably expect from a solar array over its working life, and why the figures they can see are a weak alarm.
- A domestic array has no moving parts and makes no noise, so a developing fault produces no moment anyone can point at.
- Generation data reports at system level, so a loss confined to part of the array is diluted into the total before it is displayed.
- Weather moves that total far more than condition does, and the two are not separable by looking at the number.
- IEC TS 62446-3:2017 notes that an inverter reading may not give accurate results or be calibrated, so it is an indicator rather than a measurement.
- The same standard defines thermographic inspection of modules and plants in operation, and says it may be used for periodic inspection and for investigating underperforming systems.
An array degrades quietly, and the owner is usually the last to know.
An Asset That Never Asks For Attention
The working life of a domestic array

An array is designed to be dull. Once commissioned it is a sealed, static assembly bolted to a roof, and the whole appeal of it is that it demands nothing. That same quality is what makes it difficult to supervise. A boiler that fails goes cold, a car that fails will not start, and both give the owner an unambiguous prompt. A module that begins to fail simply contributes a little less than it did, and the system as a whole absorbs the difference without complaint. Nothing trips, nothing alarms, and no part of the installation is obliged to tell anyone.
Nothing about a fault announces itself
Most of what goes wrong on a domestic array develops rather than happens. Cell damage, a failed bypass diode, a connection running warm under load, soiling that has stopped washing off: none of these produce a moment the household could point at. They change the array’s behaviour gradually, and gradual change is exactly what human memory is worst at noticing. By the time a homeowner feels that the system is not performing as it used to, the comparison being made is against a recollection of a summer several years ago, which is not evidence of anything. The array has been quietly telling nobody for a long time.
how solar panel performance changes over time, why a solar panel fault goes unnoticed, what home solar generation figures do not showhow solar panel performance changes over time, why a solar panel fault goes unnoticed, what home solar generation figures do not show
Why The Numbers Do Not Catch It
If the array will not report its own condition, the natural place to look is the generation data. Almost every domestic installation offers something: a display, an app, a monthly figure, an export reading. The difficulty is that these were built to answer a different question. They exist to tell an owner how much energy the system produced, which is a commercial question, not a condition question.
One number for the whole roof
A domestic system reports at system level. Whatever is happening on the roof arrives as one aggregated figure, and a shortfall confined to a small part of the array is diluted across the total before the owner ever sees it. That total is then moved far more violently by things that have nothing to do with condition. Cloud, season, temperature, the difference between one March and another: the ordinary swing in output between two comparable weeks can easily exceed the loss a single developing fault produces. A genuine defect can sit inside that noise indefinitely without ever forcing itself into view.
What the reading is, and what it is not
There is also a limit to how far the figure itself should be trusted as a measurement. IEC TS 62446-3:2017 makes the point plainly in its own guidance on inspection conditions, noting that an inverter reading may not give accurate results and may not be calibrated. It is a useful operational indicator. It is not an instrument, and it was never intended to serve as the evidence that an array is healthy.
Looking At The Array, Not The Total
If the output figure cannot resolve a fault, detection has to happen at the level the fault lives on, which means looking at the array itself while it is working.
Inspect the asset, not the aggregate
This is the ground the standard occupies. IEC TS 62446-3:2017 defines outdoor thermographic inspection of photovoltaic modules and plants in operation, and states that it may be used for periodic inspections and for investigating the cause of underperforming systems. Periodic is the word that matters for a homeowner. The standard treats inspection as belonging to the operating life of an array rather than to its commissioning, and frames the purpose in three parts: preventive maintenance for fire protection, the availability of the system for power production, and the quality of the modules.
When the image is not enough on its own
The same standard is candid about its own limits. It accepts that thermal abnormalities cannot always be classified with certainty from thermography alone, and requires further appropriate inspection where that is the case. In practice that is where string level electrical testing earns its place. It also records that results verify the status at the time of inspection, so a survey is a dated statement of condition and not a warranty over the year that follows.
What an owner is actually left holding
Drone Media Imaging works to Survey, Analysis and Reporting. The deliverable is a record of what the array looked like on the day, with anything found described, located and graded, and set out as areas warranting further investigation by a suitably qualified contractor. No remedial work is undertaken and none is implied. The value is narrow and real: the array stops being invisible, and the owner is no longer asking a single number to say something it cannot.

Three properties of a domestic monitoring figure limit what it can tell an owner about condition. It is aggregated, reporting the system rather than any part of it, so a localised loss is averaged into a much larger total before it is displayed. It is dominated by irradiance, meaning the weather term in the figure is far larger than the condition term, and the two are not separable by inspection of the number alone. And it is an operational indicator rather than a calibrated measurement: IEC TS 62446-3:2017 notes in its own guidance that an inverter reading may not give accurate results or be calibrated.
None of that makes monitoring useless. A sustained, unexplained departure from a system’s own established pattern is a reasonable prompt to look further, and it is a better trigger than memory. It is simply not a detector. It tells an owner what was produced, and the question of why sits outside the data entirely. That gap is the whole case for periodic inspection.
Governing Standards And Framework
- IEC TS 62446-3:2017, Photovoltaic (PV) systems, requirements for testing, documentation and maintenance, Part 3, photovoltaic modules and plants, outdoor infrared thermography. Defines outdoor thermographic inspection of modules and plants in operation, and provides for periodic inspection and for investigating underperforming systems.
- IEC 62446-1:2016, grid connected photovoltaic systems, documentation, commissioning tests and inspection. The reference for string level electrical verification, which is the scope of the electrical work undertaken.
- Survey conducted by Steve Fisher, ITC Level III Certified Master Thermographer (Infrared Training Centre; Certification #205722059), practising in accordance with the frameworks of ISO 18436-7:2014, ASNT SNT-TC-1A and ANSI/ASNT CP-105, and BINDT CMGEN Appendix B as UK training governance.
- Methodology aligned with IEC 62446-3:2017 as applicable. Findings are reported as areas warranting further investigation by a suitably qualified contractor. No remedial or corrective work is undertaken.
Find out what your array is actually doing
Drone Media Imaging carries out aerial thermographic survey of domestic and commercial solar installations, working to Survey, Analysis and Reporting, with findings set out as areas warranting further investigation by a suitably qualified contractor. Core coverage across Sussex, Hampshire, Kent and Surrey, travelling throughout the UK, Ireland and Europe, with thermography undertaken globally.
related posts
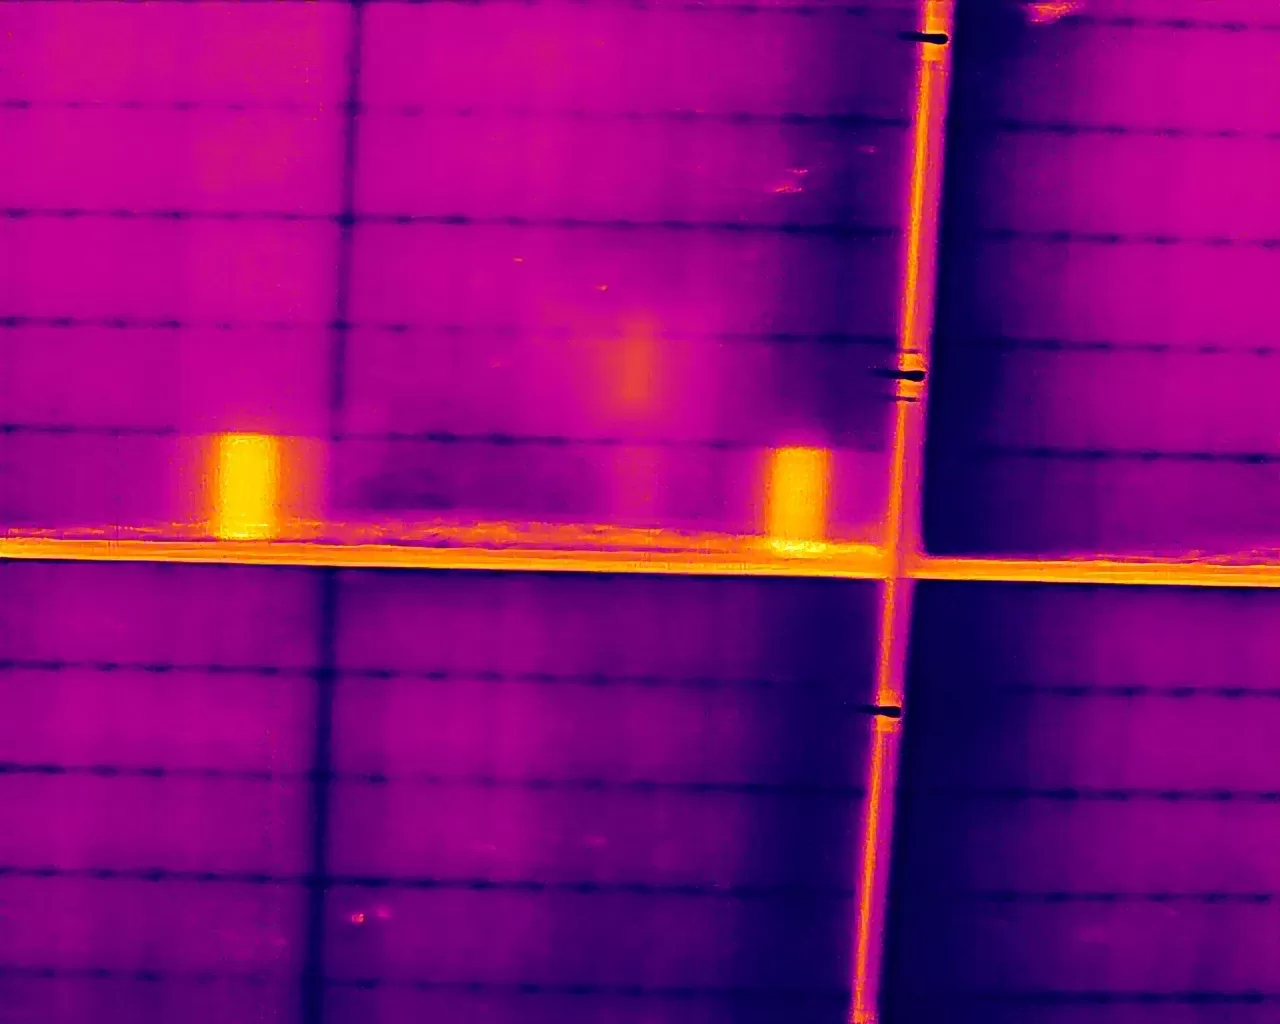
Almost every solar thermographic report leads with hot spots, but a hot spot is a symptom rather than a diagnosis. The same temperature rise can come from a bypass diode, a microcrack, potential induced degradation or a disconnected string, and one common reading is not a fault at all. This piece explains what the temperature figure does and does not tell you, and the symmetry rule that separates electrical faults from cell damage on a commercial rooftop or ground-mount array.

Conducting an IEC inspection at Trethosa, Cornwall's solar farm for Natural Generation Ltd.Drone Media Imaging examined the solar panels in line with IEC 62446-3:2017 to ensure compliance with safety standards, ensuring optimal performance and longevity of the solar farm.
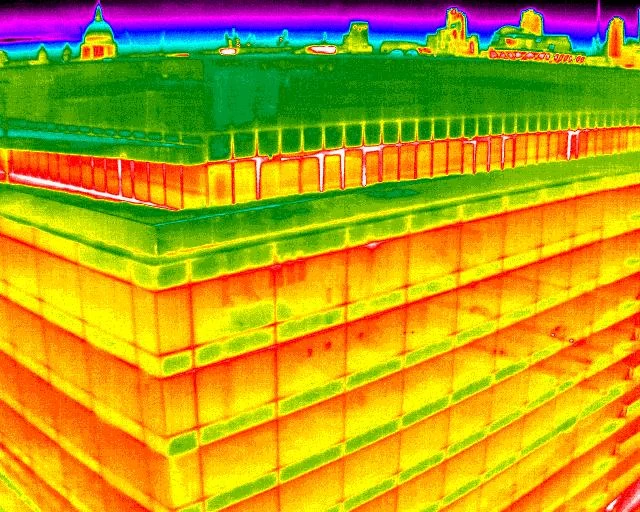
A building heat loss survey looks like a single cold night's flying, but most of what decides its value is settled beforehand. This piece sets out the information a thermographer needs from the building owner and why each answer changes how a thermal pattern is read, what has to be arranged before an after-dark survey of an occupied building, and what the finished report contains, including the difference between a certified inspection report and a professional opinion.