
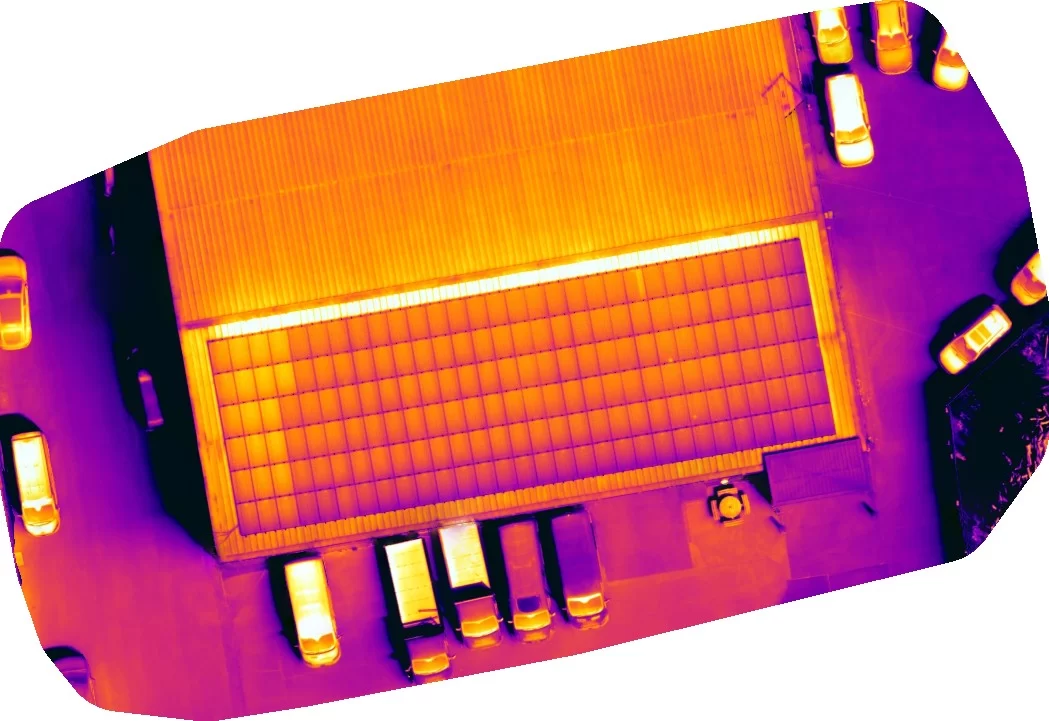
From Thermal Anomaly to Actionable Finding
A thermal image of a solar array is a persuasive thing. The warm module stands out against its neighbours, the colours look decisive, and it is easy to assume the work is finished once the picture exists. It is not.
An image records that something on the array is warmer than the modules around it. It does not say which module, how much warmer than what, whether the pattern is a fault or a reflection, how serious it is, or what should happen next. Those are separate questions, and answering them belongs to the analysis and reporting half of the job rather than the flying half.
What a client commissions is not a set of pictures. It is a document in which every anomaly has been identified, located precisely enough to walk to, measured against a reference, classified for severity, and given a consequence. That document has to hold up when somebody who was not there reads it months later, possibly in front of an insurer or a warranty administrator.
What follows is the anatomy of that document. It covers what the reporting clause of IEC 62446-3 requires a survey report to carry, how an anomaly becomes a finding, and why the distinction matters to whoever ends up relying on it. The short version is that the picture is evidence, and the report is the argument built on it.
Blog Content TL;DR...
What a solar PV thermographic survey actually delivers, and why the report rather than the imagery is the thing worth buying.
- An anomaly becomes a finding only when it has an identity, a location, a comparison against a reference and a classification attached to it.
- IEC 62446-3 requires each thermal anomaly to be positioned using at least two independent identification methods, so the right module can be found on site.
- Clause 8 of the standard sets out what the report must contain, from the environmental conditions and the scope as contracted through to the recommended actions.
- Severity and consequence are carried separately, because a modest temperature rise can be safety relevant and a dramatic one can be purely a yield question.
- The same document is read by asset owners, maintenance contractors, insurers and warranty administrators, each asking a different question of it.
A photograph shows you something is wrong. A report tells you where, how badly, and what to do about it first.
What Turns an Anomaly Into a Finding
Identity, location, comparison and classification
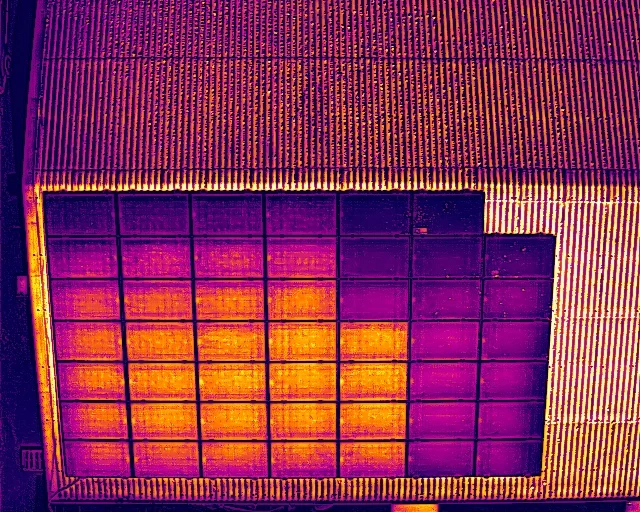
An anomaly is an observation, not a conclusion
A warm area in a thermogram is an observation. Turning it into a finding means attaching four things to it that the image alone does not contain: an identity, a location, a comparison and a classification. Miss any one of them and what the client holds is a photograph with a caption.
Identity is the least glamorous and the most important. Every finding traces back to the original radiometric file it came from, by filename, so that the conclusion can be checked against the source rather than taken on trust. A report whose images cannot be tied to the capture they came from cannot be audited, and anything that cannot be audited is difficult to rely on in a dispute.
Located precisely enough to walk to
Location is where most of the practical value sits. A finding that says a module is running hot somewhere on a roof is close to useless to the person sent to look at it. IEC 62446-3 requires the position of each noticeable thermal spot to be given using at least two independent identification methods, drawn from a defined list: a serial number, a photograph showing the position in the array, column and row coordinates, a marking in the system documentation, or a permanent mark on site.
Two methods rather than one is a deliberate redundancy. Row and column notation alone can be misread on a symmetrical array, and a photograph alone can be ambiguous on a large roof. Together they converge on one module, which is what somebody standing on the roof with the report in their hand actually needs.
what a solar thermographic survey report contains, how solar panel faults are located and prioritised, what to do with solar inspection findingswhat a solar thermographic survey report contains, how solar panel faults are located and prioritised, what to do with solar inspection findings
The Reporting Framework Behind the Document
What the standard asks a report to contain
IEC TS 62446-3:2017 is the technical specification for outdoor infrared thermography of photovoltaic modules and plants, and its reporting requirements sit in Clause 8. The clause is a list, and reading it as a list is the quickest way to understand why a defensible report looks the way it does.
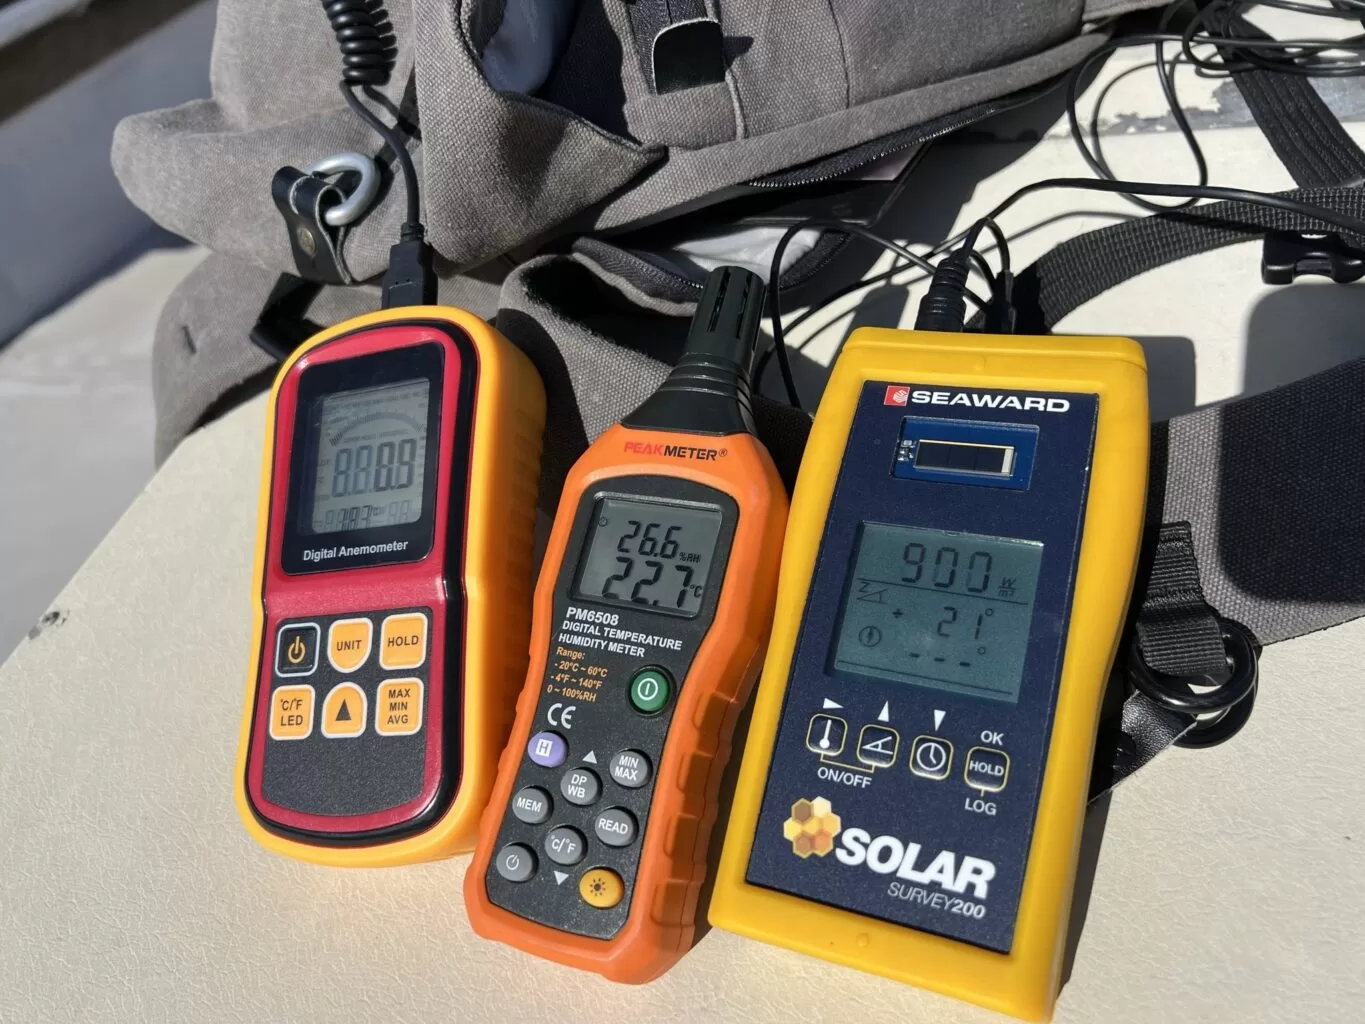
It asks for the people involved and the equipment used. It asks for the date, the time and the location. It asks for the scope as contracted, which matters because a survey answers only the question it was commissioned to answer. It asks for the environmental conditions, specifically air temperature, wind speed and direction, cloud cover and the irradiance measured in the plane of the module rather than on the flat. It asks for the condition of the array, the inspection procedure followed, the list of thermal anomalies with their positions, the recommended actions based on their classification, and a summary.
Then it asks the same discipline of every image. Each thermogram carries a description of the object, the file name, the date and time, the camera system and lens, and the emissivity and reflected temperature used to make the measurement. Those last two are the difference between a number and a guess, because a radiometric temperature is only meaningful when the surface assumptions behind it are stated.
Why the conditions are part of the evidence
Recording the conditions is not administrative padding. A thermal survey of a solar array measures the heat produced by current the array is generating, so the reading is only interpretable against what the array was doing at the time. Logging irradiance, wind and cloud at the start and end of the session lets a later reader judge whether the survey was valid, and whether a quiet result means a healthy array or an unrepresentative afternoon.
Who Reads It, and Where It Stops
The same document, four different readers
A survey report is read by people with different questions. An asset owner wants to know what to spend money on first and what can wait until the next inspection. An operations and maintenance contractor wants a work list precise enough to plan a visit around, with each item located and prioritised. An insurer wants evidence that the array has been examined competently against a recognised standard, and that anything safety relevant was identified and escalated rather than logged. A manufacturer handling a warranty claim wants the defect demonstrated, dated and tied to a specific module.
One document has to serve all four, which is why severity and consequence are carried separately. A finding can be thermally modest and still safety relevant, or thermally dramatic and purely a question of lost yield. Collapsing both into a single number loses the distinction the reader needs in order to decide anything.
What the report does not do
A thermographic survey is a non-intrusive, qualitative examination of what the array was doing on the day. On its own it does not test the electrical installation, it does not diagnose the cause of what it sees, and it cannot detect a fault that produces no thermal signature. Where the thermal picture needs corroborating, string-level electrical testing is a separate scope that runs alongside it. The standard is explicit that thermography alone cannot always classify an abnormality beyond doubt, and that further appropriate inspection is required where it cannot.
So the report ends where it should. Findings are areas warranting further investigation by a suitably qualified contractor, presented in the order that investigation should happen, with the evidence attached so that the contractor arrives knowing what they are looking for. That is the boundary between a survey and a repair.
IEC TS 62446-3:2017, Edition 1.0, is the technical specification covering outdoor infrared thermography of photovoltaic modules and plants. It sits within the IEC 62446 series on testing, documentation and maintenance of PV systems.
Clause 8 sets out the inspection report. It requires the personnel and equipment involved, the date, time and location, the scope as contracted, the environmental conditions including irradiance in the plane of the module, the soiling condition of the array, the inspection procedure, a listing of thermal anomalies located by at least two independent identification methods, recommended actions based on classification, and a summary of results. Every thermogram carries its own metadata: object description, file name, date and time, camera system and lens, and the emissivity and reflected temperature applied.
Clause 7.3 classifies abnormalities into three classes, running from no abnormality, through a thermal abnormality to be checked and rectified in a reasonable period, to a safety relevant abnormality calling for prompt interruption of operation. Annex B sets the competence requirement for the personnel carrying out and interpreting the work.
Governing Standards
- IEC TS 62446-3:2017, outdoor infrared thermography of photovoltaic modules and plants, governing the survey methodology and the reporting requirements described here.
- IEC 62446-1:2016, where string-level electrical testing forms part of the agreed scope alongside the thermal survey.
- Analysis, interpretation and report preparation by an ITC Level III Certified Master Thermographer (Infrared Training Centre; Certification #205722059).
- Practising in accordance with the frameworks of ISO 18436-7:2014, ASNT SNT-TC-1A and ANSI/ASNT CP-105, with BINDT CMGEN Appendix B as UK training governance.
- Findings represent the thermal condition of the array at the time of inspection, and are areas warranting further investigation by a suitably qualified contractor.
Commission a Solar PV Thermographic Survey
If you are commissioning a solar survey, ask what the deliverable looks like before you compare prices. Drone Media Imaging works across Sussex, Hampshire, Kent and Surrey, travels throughout the UK, Ireland and Europe, and reports every anomaly located, classified and prioritised so that the findings can be acted on.
related posts

Quantitative and qualitative thermography are two essential methods in thermal imaging analysis. Quantitative thermography measures exact temperature values, while qualitative thermography focuses on pattern recognition. Both play a crucial role in building inspections, electrical fault detection, and industrial diagnostics. Understanding their differences helps professionals choose the right approach for accurate thermal assessments. Drone Media Imaging provides expert thermographic services, ensuring precise, reliable results. Contact us today for professional thermal imaging analysis.
Commissioning aerial photography, a roof inspection or a solar survey means buying the legal basis of the flight as well as the imagery. UK drone regulation changed completely in 2020, and the old shorthand no longer describes anything real. This is a plain guide to the four documents a professional operator should be able to produce on request, what each one actually permits, and the site-specific paperwork a properly run job generates before anybody takes off.

A site owner's question is usually whether a drone is allowed. The regulations answer a different one: how far the aircraft must stay from people who are not part of the operation. That distance is not fixed. It moves with the authorisation the operator holds, the mass and class of the aircraft flown, and how the people on site are briefed. This is what actually decides whether a working site can be flown, and the small part the client plays in it.