A Building Warming Up Is Not a Building Losing Heat
Most people planning a heat loss survey know it needs a cold night. Far fewer know it also needs a building that has been heated properly for long enough beforehand, and that the second condition is just as easy to get wrong as the first. A thermal survey reads the temperature of the outside surface of the walls and roof. That surface only tells you how much heat is escaping once the flow of heat through the fabric has settled into a steady rhythm.
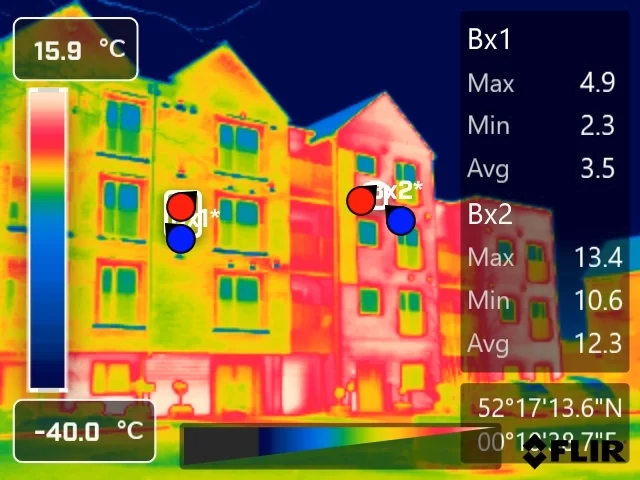
Turn the heating up an hour before the drone flies, or switch it on in a building that has stood cold all week, and the camera records something else entirely: a building in the middle of warming up. Heavy walls are still soaking up heat and passing little of it through. Lighter elements such as windows, panels and thin sections respond far sooner. The result is a set of patterns that look like defects and are nothing of the kind, while some genuine defects stay hidden until the fabric catches up.
The property behind this is thermal mass, the capacity of a material to store heat and release it slowly. This post explains what it does to a heat loss thermogram, why it means the heating regime is agreed as carefully as the weather, and how Drone Media Imaging records the conditions so that anyone reading the report can see the building was ready.
Blog Content TL;DR...
A heat loss survey needs a settled building as much as it needs a cold night.
- A thermal camera reads the outer surface, which only reflects true heat loss once the flow through the fabric has settled.
- Thermal mass delays and dampens any change in heating, and in heavy masonry the delay can run to many hours.
- Lightweight elements respond first, so a building imaged while warming up shows patterns that look like defects and are not.
- Unheated rooms read from outside as cool patches, so which spaces were heated is part of the analysis.
- The heating regime is agreed before the date is set, and conditions are logged at the start and end of every survey.
The camera can be set in minutes. The building takes longer, and the survey waits for it.
What a Wall Is Really Reporting
A surface temperature only means something once the heat flow behind it has settled
Heat loss is a flow, and the camera sees where it ends
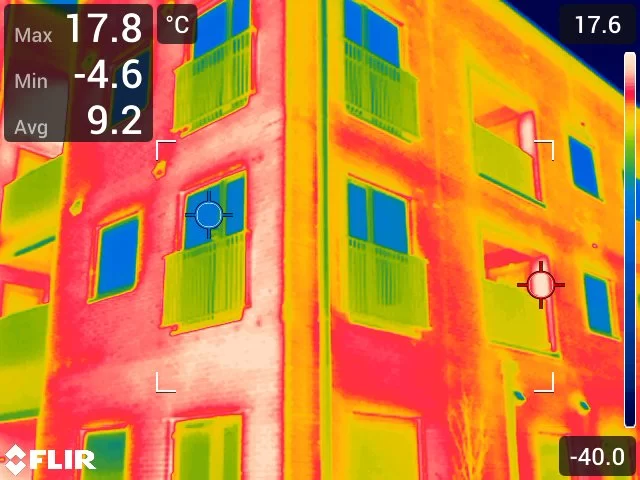
Heat moves continuously from a warm interior to a cold exterior, through plaster, masonry, insulation and render in turn. The thermal camera sees none of that journey. It reads only the outer surface, where the heat arrives and is lost to the night air and the sky. Where insulation is missing or a cold bridge runs through the wall, more heat arrives at that point, and the surface reads slightly warmer than its surroundings. That small difference is the whole basis of the survey.
Steady state, and why it matters
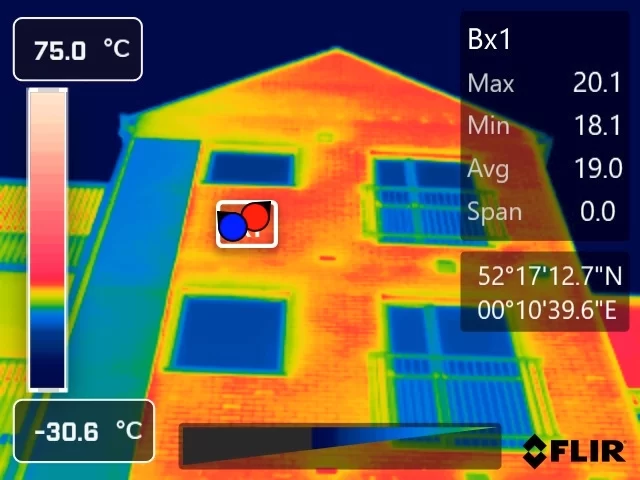
The surface pattern is only a fair picture of the wall when the flow has stopped changing, a condition known as steady state. In steady state, the heat leaving the outer face matches the heat entering the inner face, so the outside surface genuinely reflects how well each part of the wall resists heat loss. Out of steady state, the outer face reflects something different: how far each part of the wall has got in warming up or cooling down. Those two pictures can look alike on a screen and mean opposite things.
Not every material moves at the same pace
A solid brick or stone wall holds a great deal of heat and changes temperature slowly. A window, a lightweight panel, a timber-framed section or a thin infill responds much faster. A building is almost always a mix of both. So a change in heating does not travel through the envelope evenly, and for a period after any change different parts of the same elevation are reporting different moments in time. Setting the camera correctly, covered in what turns a thermal picture into evidence, cannot correct for that. Only time can.
Thermal Mass and the Heat Loss Survey, Why the Heating Must Run Before a Thermal Survey, Steady State Thermal Imaging of BuildingsThermal Mass and the Heat Loss Survey, Why the Heating Must Run Before a Thermal Survey, Steady State Thermal Imaging of Buildings
Why the Fabric Lags Behind the Thermostat
Delay and dampening
When the temperature on one side of a wall changes, two things happen before it shows on the other side. It is delayed, because the material between has to absorb heat before it can pass any on. It is also dampened, because much of the change is stored rather than transmitted. In a heavy masonry wall the delay can run to many hours, which means the outer face of a solid wall is often still reporting conditions from earlier in the day, or from the day before.
The buildings where this goes wrong
The risk is greatest where the heating is not continuous. An office heated during the working week and set back at weekends, a church warmed for a service, a school over a holiday, or a vacant unit with the heating switched on specially for the survey: each puts the fabric into a period of change. Image one too soon and the lighter elements glow against heavy walls still catching up. Window surrounds, lintels and panels can read as poor performers simply because they responded first, and a cold bridge in a solid wall can stay invisible because the warmth has not yet reached it.
The inside has to be consistent as well
The same logic applies room by room. An unheated room, or one with a door propped open to the cold, sends less heat into its walls, and from outside it reads as a cool patch very like missing insulation. Part of the analysis is knowing which rooms were heated, so a cool area is read against the conditions behind it rather than at face value. That is why the heating arrangements are part of the survey plan, and why what a heat loss survey needs from you starts with them.
What This Means Before the Survey Date
The heating regime is agreed, not assumed
Drone Media Imaging asks how a building is heated and used before a survey date is proposed. Which spaces are heated, whether the system runs continuously or to a timer, and whether parts of the building are closed off all change what the fabric will be doing on the night. How long the heating needs to have been running steadily depends on the construction and the way the building is used, so it is set for each survey rather than taken from a rule of thumb, and it is agreed before the date is confirmed.
The weather still has to cooperate
A settled building is only half of it. The survey also needs a large enough difference between inside and outside, a still night and fabric that has shed the day’s sunshine, which is why the work runs in the colder months, as explained in why a building thermal survey only works in the cold months. Both conditions have to hold at the same time, so a date is proposed against the forecast and the building together rather than accepted because it happens to be winter.
The conditions travel with the findings
Air temperature, humidity and wind are logged with a handheld environmental meter at the start and end of each survey, alongside the internal temperatures and the heating arrangements confirmed on the day. A report that shows the conditions holding steady from first image to last can be read with confidence. Where they drifted, the report says so. Every finding is presented as an area warranting further investigation by a suitably qualified contractor. The scope of the service is set out on our building heat loss surveys page, part of our wider drone thermography services.
A U-value describes heat loss through a building element in steady state, with the temperatures either side held constant. It says nothing about how quickly the element reaches that state. That behaviour is described by its dynamic thermal characteristics, calculated by the method set out in EN ISO 13786.
Three of those quantities carry most of the meaning for a survey. Areal heat capacity is the heat a square metre of the element stores for each degree its temperature rises, and it is what makes a heavy wall slow to respond. Time shift is the delay, in hours, between a temperature change on one face and its effect reaching the other. The decrement factor is the fraction of a temperature swing that survives the journey through the element, so a small figure means a heavily damped wall.
Lightweight and well-glazed elements combine low heat capacity with short delays, while solid masonry combines high capacity with long ones. That contrast within a single elevation is why survey timing follows the slowest element on the building, not the quickest.
Governing Standards
- BS EN ISO 6781-1:2023, Performance of buildings. Detection of heat, air and moisture irregularities in buildings by infrared methods. General procedures, the building envelope methodology with which this work is aligned.
- EN ISO 13786, Thermal performance of building components. Dynamic thermal characteristics. Calculation methods, the basis of the thermal mass quantities described in the Technical Reference.
- Thermographic inspection, analysis and reporting are conducted by Steve Fisher, ITC Level III Certified Master Thermographer (Infrared Training Centre; Certification #205722059), practising in accordance with the frameworks of ISO 18436-7:2014, ASNT SNT-TC-1A and ANSI/ASNT CP-105, and BINDT CMGEN Appendix B (UK training governance).
Plan a Building Heat Loss Survey
Drone Media Imaging carries out building heat loss survey, analysis and reporting across Sussex, Hampshire, Kent and Surrey, travelling throughout the UK, Ireland and Europe. Tell us how your building is built, heated and used, and we will propose survey dates and the conditions the building needs to meet on the night, so the findings stand up when they are read.
related posts
Explore the crucial role of drone thermal imaging in boosting fire safety measures at solid waste landfill sites.

Thermal inspections can help domestic solar panel owners detect issues early, preventing costly repairs. These inspections identify hotspots, indicating potential problems like loose connections or damaged cells. By addressing these issues promptly, owners can ensure optimal performance and longevity of their solar panels, maximizing their return on investment.

Plenty of commercial property sits close to an airport, and a Flight Restriction Zone reaches well beyond the perimeter fence. A site two miles from a runway, with no view of it, can still sit squarely inside the zone. This post explains what those zones cover, the three separate permissions that people tend to treat as one, why the airspace approval is assessed flight by flight rather than granted once, and what to tell your operator before the date is agreed.