Utility-Scale Solar Thermographic Inspection of a 14.55 MWp Array
IEC 62446-3 Thermographic Inspection Across 20,496 Solar Modules
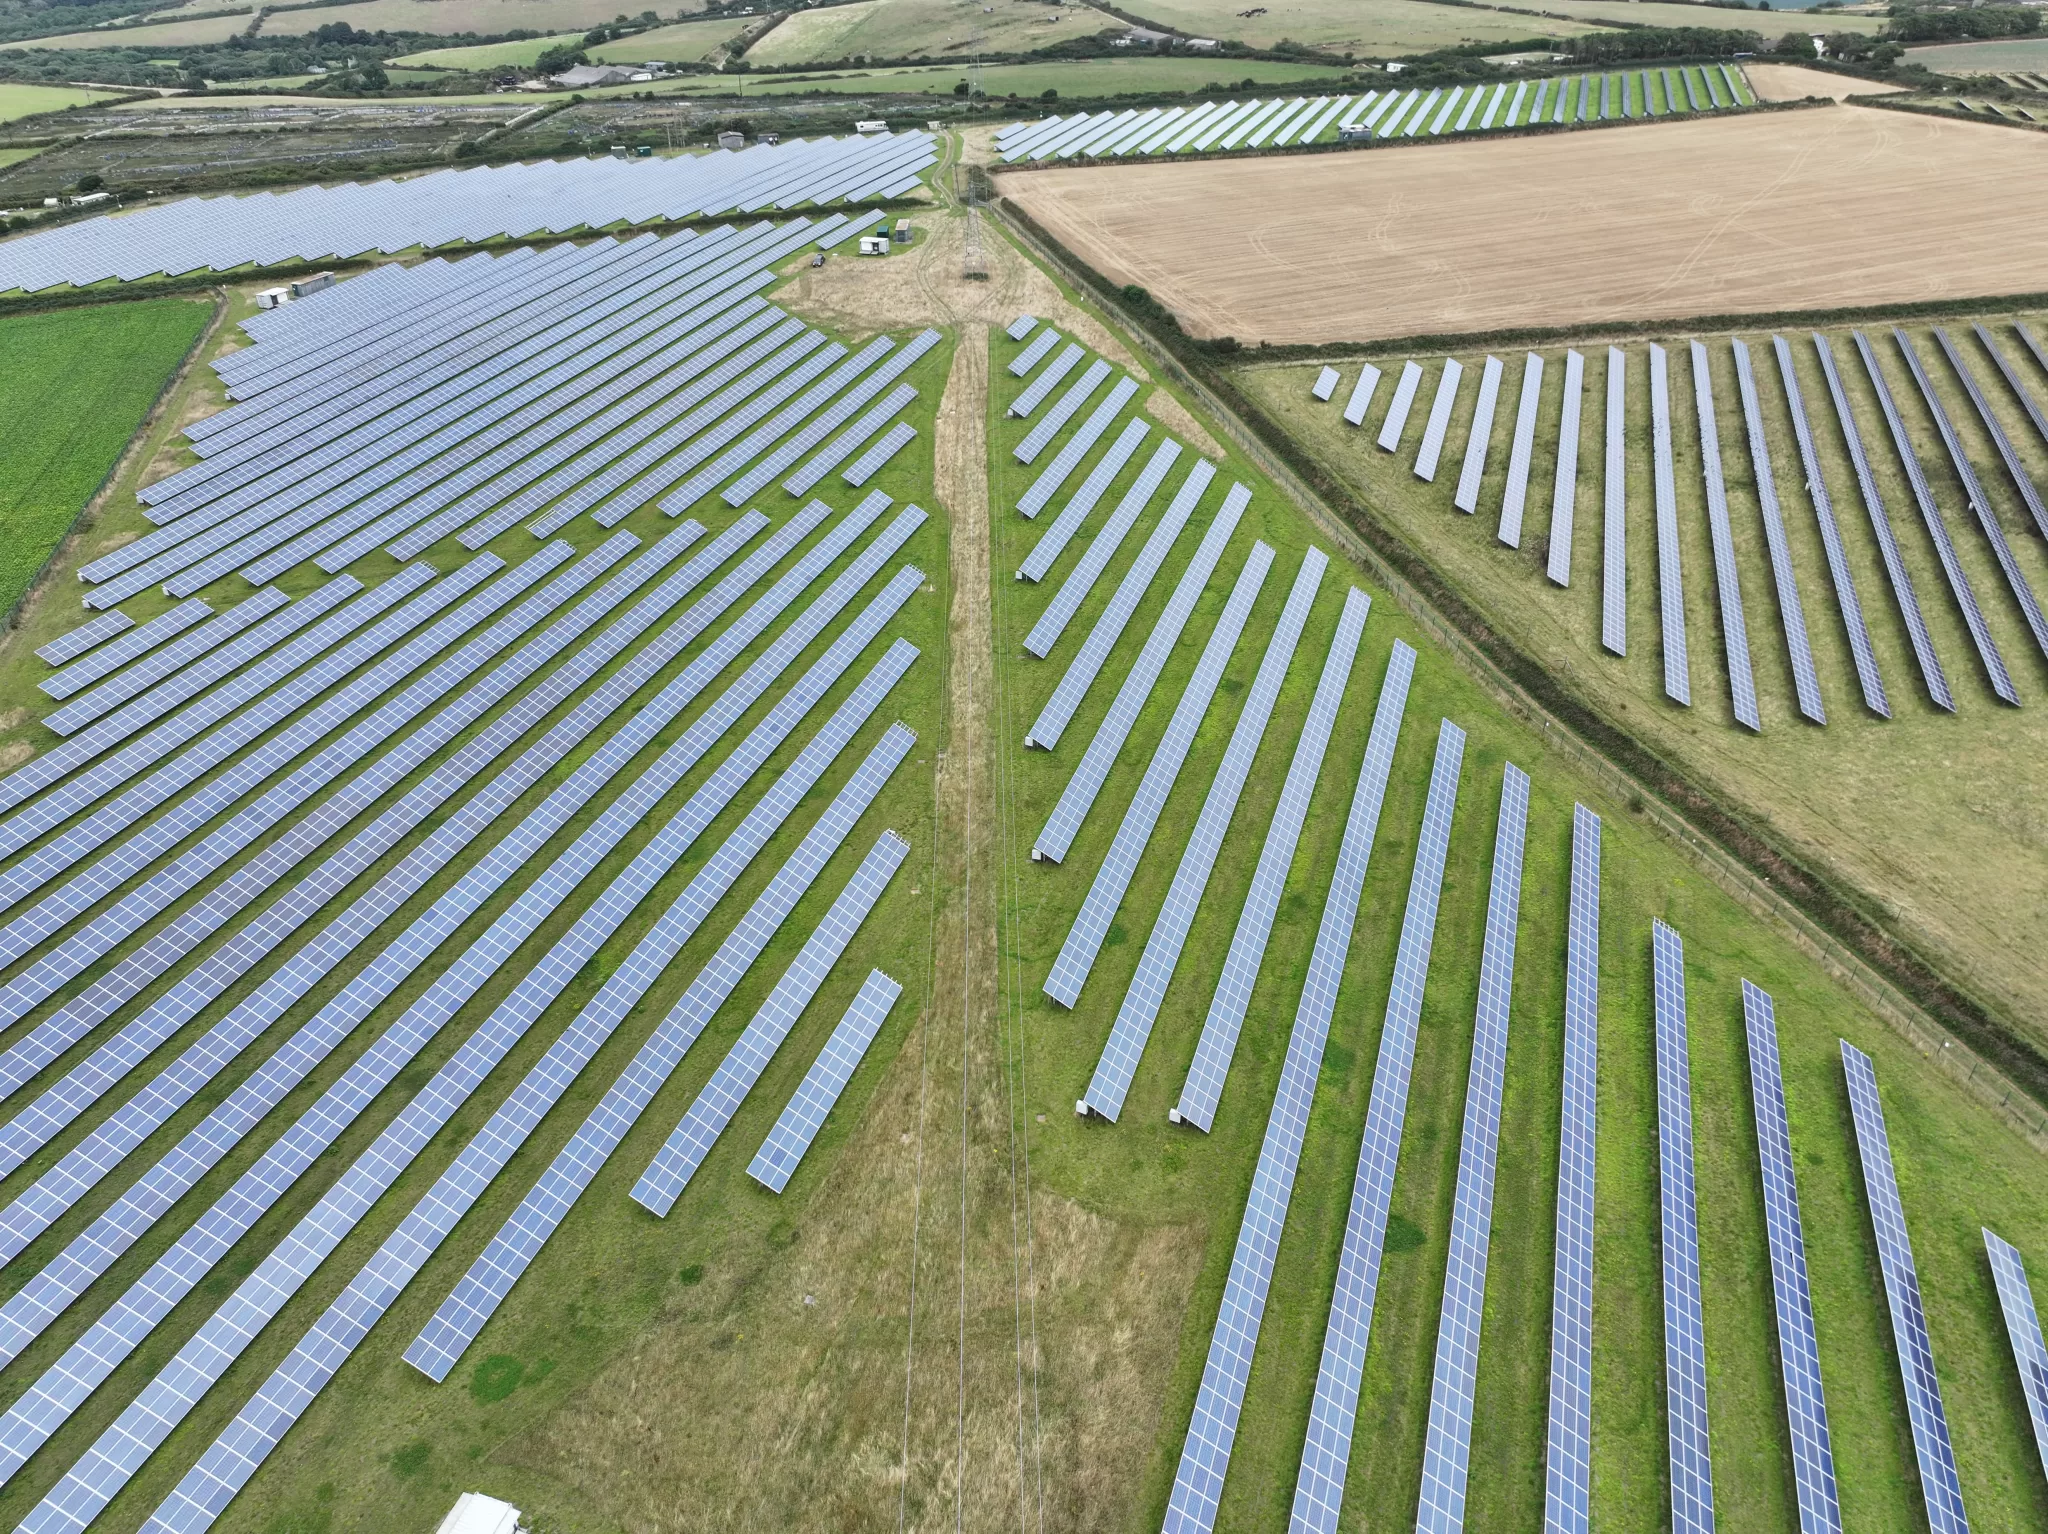
Drone Media Imaging carried out a utility-scale solar thermographic inspection of a newly commissioned 14.55 MWp ground-mounted array in the East of England, covering all 20,496 modules across two fields in compliance with IEC 62446-3:2017. The survey was flown as four inspection zones plus a site overview during a single afternoon window, with in-plane irradiance held between 747 and 1,025 W per square metre and the plant energised and generating throughout. Twelve thermal anomalies were classified at cell, sub-string, module and string level, ranging from early-stage cell activity to a cell cluster running 56.5 degrees Celsius above its module baseline and carrying a safety consequence. Every finding was located by coordinate and plotted onto a survey-grade orthomosaic of the site flown for the purpose. As the first thermographic inspection of the installation, the survey establishes the certified baseline against which every future inspection of the asset will be compared.
Project Overview
Subject
utility-scale solar thermographic inspection, IEC 62446-3 solar inspection, commissioning baseline thermography, ground-mounted solar farm survey, East of England
Skills Used
IEC 62446-3 Solar Thermographic Inspection, Aerial Thermographic Survey, Level 3 Report Writing
Portfolio Tags
Solar Thermography, IEC 62446-3, Utility-Scale Solar, Commissioning Inspection, Drone Thermal Survey, Ground-Mounted PV, Solar Asset Owners, What Does A Solar Commissioning Survey Find
Drone Thermographic Survey Of A Utility-Scale Solar Farm, IEC 62446-3 Commissioning Baseline Inspection, Level 3 Thermographic Analysis And ReportingDrone Thermographic Survey Of A Utility-Scale Solar Farm, IEC 62446-3 Commissioning Baseline Inspection, Level 3 Thermographic Analysis And Reporting
Utility-Scale Solar Thermographic Inspection of a 14.55 MWp Array
~ Twenty thousand modules, one afternoon, and a baseline the site will be measured against for thirty years. ~
A new solar farm has no history, so the first survey is the one that creates it.
IEC 62446-3 Thermographic Inspection Across 20,496 Solar Modules
The client is an energy developer building and commissioning utility-scale solar across the United Kingdom. The site is a newly completed 14.55 MWp ground-mounted array in the East of England, laid out as two fields of fixed-tilt tables carrying 20,496 bifacial modules. Drone Media Imaging was engaged to carry out the commissioning thermographic inspection of the whole installation before it settled into routine operation.
A commissioning survey answers a different question from a maintenance one. On an established plant a thermal inspection looks for what has gone wrong since last time. On a plant entering service there is no last time, so the survey has two jobs at once: find anything already wrong, and record the condition of every module while that condition is still attributable to manufacture, transport and installation rather than to years of weather. That record is what gives an asset owner something to point at when a fault appears in year three.
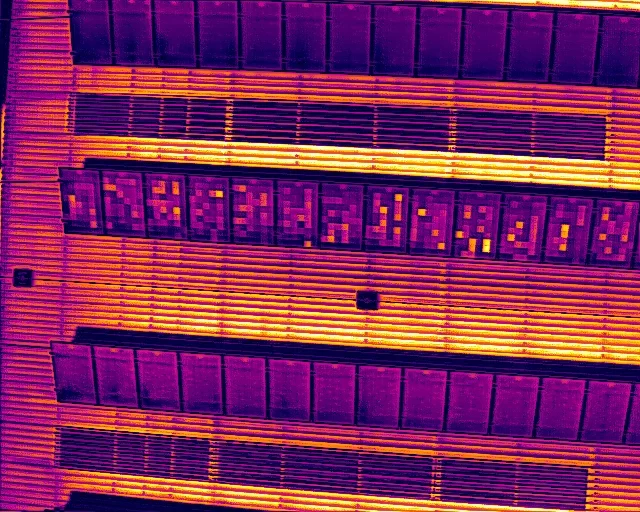
Thermography suits this because a photovoltaic module that is not exporting current still absorbs sunlight, and the energy it fails to convert to electricity leaves as heat. A cell, a group of cells or a whole series-connected string that has stopped contributing therefore runs measurably warmer than its neighbours, in a pattern that indicates what has happened to it. None of that is visible from the ground, and a plant this size can lose a full string without the change being obvious in the headline generation figure. Drone Media Imaging is a trading name of VisualChaos Studios Ltd.
Governing Standards
- IEC 62446-3:2017 Sets the requirements for outdoor infrared thermography of photovoltaic modules and plants, and governs the survey conditions, the equipment, the classification of abnormalities and the content of the report.
- ISO 18436-7 The framework for thermographic condition monitoring personnel against which our Level 3 practice is aligned, covering the competence required to interpret thermal data rather than simply capture it.
How was the inspection carried out across twenty thousand modules?
Commissioning Baseline Thermography for a Ground-Mounted Solar Farm
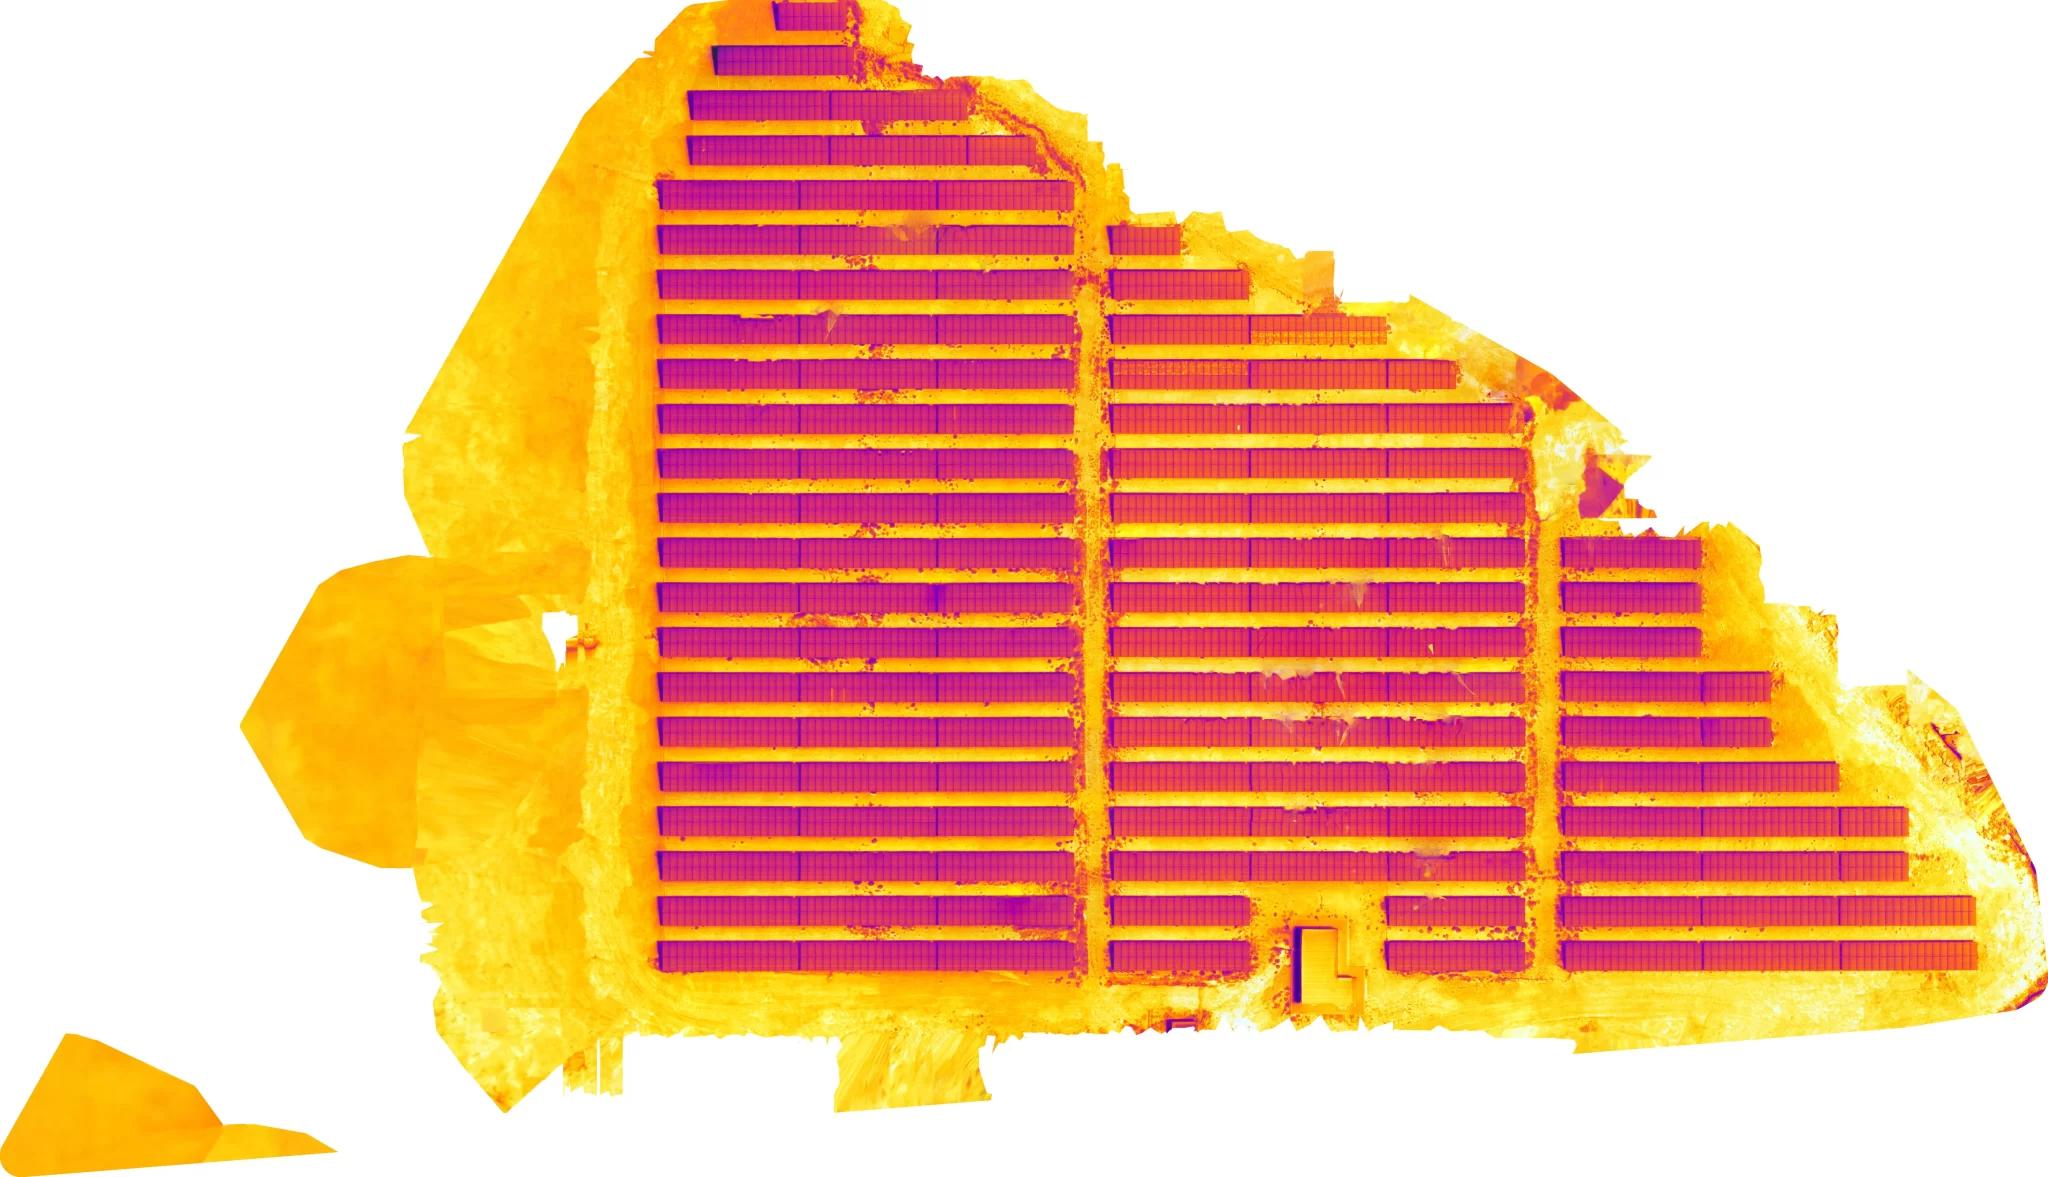
The work was flown in two phases. The first produced a survey-grade orthomosaic of the whole site using real-time kinematic positioning, which served both as the as-built positional record and as the basemap for planning the thermal flight lines. The second was the thermal survey itself, held back until the conditions the standard requires could be met on the day.
IEC 62446-3 sets those conditions tightly, because a thermal signature only appears when the array is working hard. Irradiance in the plane of the array must exceed 600 watts per square metre, the sky must be clear or near-clear, the modules must be dry, and the plant must be energised and generating under normal load. On the day the array was captured between just before and just after solar noon, with in-plane irradiance recorded at the start and end of every zone and ranging from 747 to 1,025 watts per square metre. Cloud cover was one okta, there was no precipitation, and mean wind sat below four metres per second.
The array was flown as four inspection zones, two per field, on automated waypoint missions running along the table rows at a fixed height above the modules and a ground sample distance of three centimetres per pixel, which resolves individual cells. A fifth pass at higher altitude covered both fields for site context only. Environmental conditions were logged continuously alongside the capture, and the radiometric parameters were set and recorded per zone rather than assumed across the day.
- Included: full thermographic coverage of all 20,496 modules, anomaly classification at cell, sub-string, module and string level, Level 3 analysis and certified reporting, and a georeferenced site orthomosaic.
- Excluded: electrical string testing, inverter diagnostics, any interaction with live equipment, and any remedial or corrective work.

What did the survey find across the array?
Twelve anomalies were classified: one Critical, one High, seven Medium and three Low. Three further observations sat below the classification threshold and were recorded for reassessment rather than action. For a plant of this size entering service, that is a clean result, and the distribution matters more than the count.
The one finding carrying a Safety consequence was a cluster of cells within a single module reaching 101.4 degrees Celsius, some 56.5 degrees above the reference module baseline for that capture, with three further cells in the same cluster elevated between 20 and 25 degrees. Sustained temperature at that level exceeds the point at which the encapsulant bonded behind the cell begins to degrade, and degraded encapsulant is the precursor to the insulation breakdown from which a direct current arc fault can start. That is why the temperature matters rather than simply the lost output.
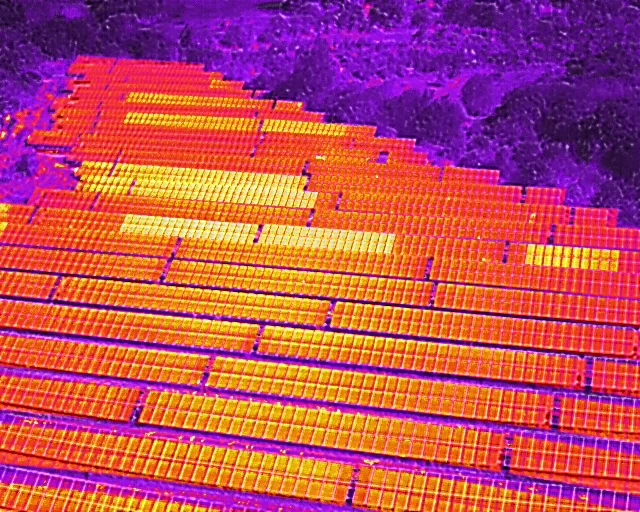
The largest yield matter was quite different in character. Two adjacent table arrays, twenty-eight modules each, ran uniformly elevated across their full extent, recorded across six consecutive captures as a single condition. Uniform elevation with no discrete hotspot and no cellular structure is the signature of a series-connected group that remains illuminated while not delivering current. Because every module in the group is affected rather than one module within it, the loss is proportionate to the group. The remainder were discrete conditions at cell and sub-string scale, each confined to a single module, including several where a sub-string was carrying current through its bypass diode rather than generating.
What was the outcome for the asset owner?
The deliverable is a certified Level 3 thermographic inspection report, signed off by our Level 3 Master Thermographer, in which every classified anomaly carries three outcomes: a severity banded on the measured temperature difference above a reference module in the same thermal image, a consequence describing what the finding means operationally, and the corresponding classification under the standard and its Annex C conditions. Every finding is located by the coordinate recorded at capture and plotted onto the site orthomosaic, so a technician can walk to the right row rather than hunt a field of twenty thousand modules.
That approach replaced the column-and-row grid map conventionally used on rooftop arrays, which does not scale to a site of this size. Positioning the findings on a survey-grade basemap instead gave the owner something usable in their own systems, and the thermal image itself identifies the affected module from the pattern of the table around it.
The survey now stands as the site’s certified thermal baseline. Every future inspection is compared against it, and any anomaly appearing later can be tested against a documented record of how that module looked when the plant entered service.
- Investigate the safety finding in its own right rather than within a routine maintenance cycle
- Prioritise electrical investigation of the string-level condition ahead of the discrete cell-scale findings
- Monitor the cell-scale findings and the sub-threshold observations at the next inspection
- Retain the report and the orthomosaic as the baseline record for the asset
Investigation of findings of this kind should be carried out by a suitably qualified electrical contractor. Thermography identifies thermal conditions and their likely mechanisms; it does not establish electrical root cause, and it is deliberately positioned as the survey that tells a contractor where to look.
What made this survey unusual?
Scale changed the method rather than simply the effort. At 20,496 modules the conventional grid map becomes unusable, so the whole positional approach was rebuilt around survey-grade coordinates and a georeferenced basemap. The module technology mattered too: at 22.9 per cent efficiency these panels convert far more incident energy than the reference case the standard’s example conditions assume, so a given fault produces a larger temperature difference. Recognising that prevented several ordinary open-circuit conditions from reading as worse than they were.
Commissioning a solar asset? Record it before it ages
Drone Media Imaging, a trading name of VisualChaos Studios Ltd, delivers IEC 62446-3 thermographic inspection of solar installations from single rooftops to utility-scale farms. Level 3 analysis and certified reporting throughout, from Sussex, Hampshire, Kent and Surrey, travelling across the United Kingdom, Ireland and Europe.