Solar PV Thermographic Inspection of a West Midlands Distribution Centre Rooftop
Why a 50 kWp Rooftop Solar Array Needed a Thermographic Inspection
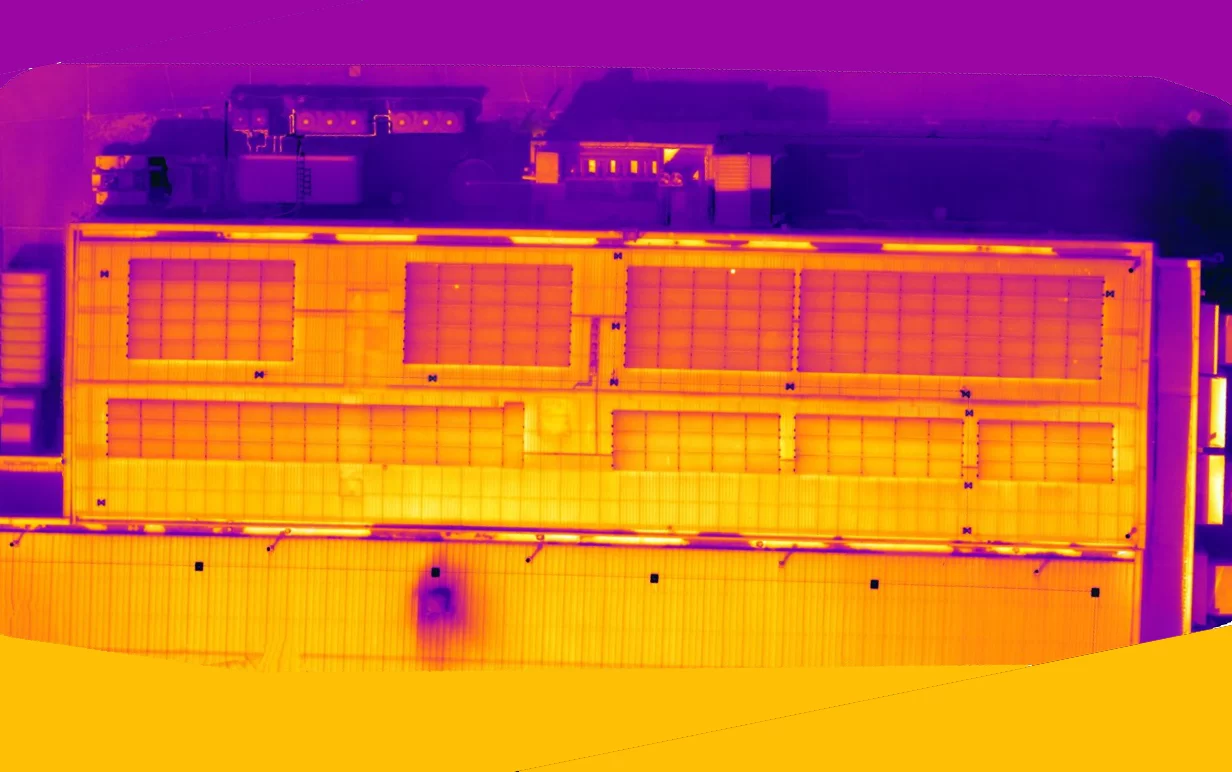
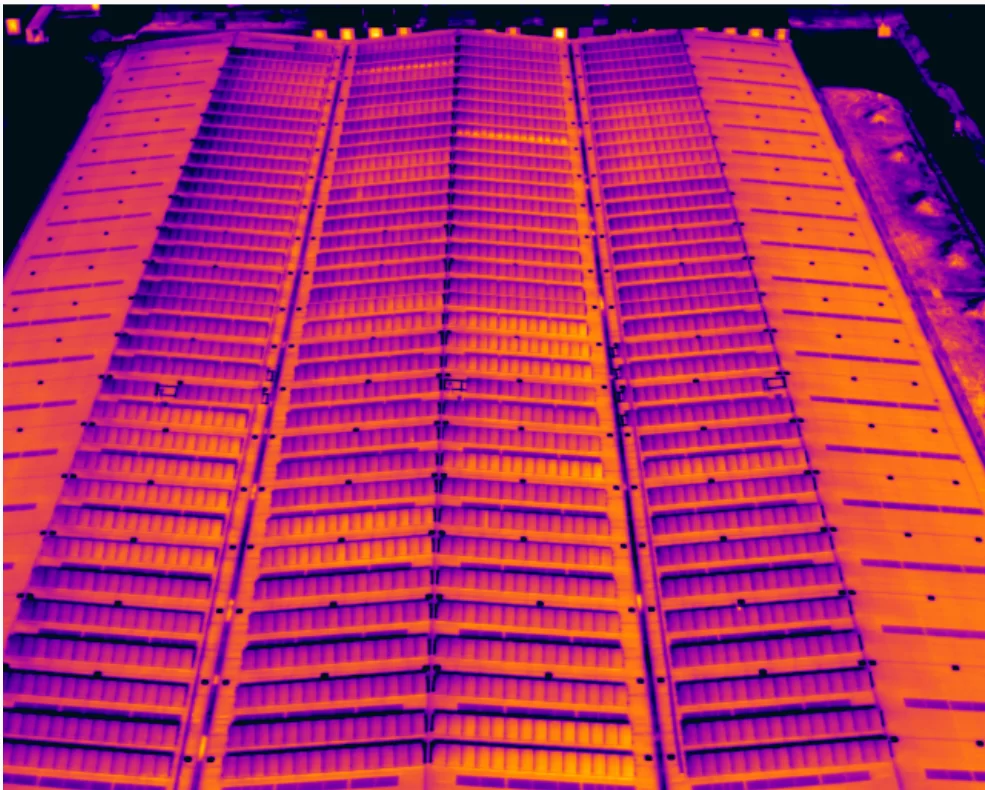
This solar PV thermographic inspection covered a 50 kWp rooftop array at a large food distribution centre in the West Midlands, comprising 200 modules across a single roof zone served by two inverters. The survey was flown by drone under IEC 62446-3:2017, on a clear July day chosen so that irradiance, wind speed and cloud cover all sat inside the operating conditions the standard requires. Six findings were classified across five thermograms. One carries a Safety consequence: a single cell was recorded above the absolute temperature at which structural fire risk is treated as credible on a commercial roof, which is a mandatory Safety trigger. One carries a Yield consequence, a contiguous block of twenty modules running warm as a unit, a pattern consistent with a string that is not delivering power to its inverter and is therefore generating nothing. The remaining four are classified Degradation Trajectory, mechanisms that characteristically develop and warrant reassessment. Every finding was assessed against a clean reference module within its own thermogram, and the asset owner received a prioritised list of locations for a suitably qualified electrical contractor to investigate.
Project Overview
Subject
solar PV thermographic inspection, rooftop solar array survey, West Midlands, commercial asset owners, IEC 62446-3:2017
Skills Used
IEC 62446-3 Solar Thermographic Inspection, Hotspot Detection, Level 3 Report Writing
Portfolio Tags
Solar PV Inspection, Rooftop Solar Array, Thermal Drone Survey, West Midlands, IEC 62446-3, Commercial Asset Owners, Drone Media Imaging, How Do You Find A Faulty Solar String?
How Are Solar Panel Faults Found Using Thermal Drone Imaging, Commercial Rooftop Solar Inspection In The West Midlands, What Does An IEC 62446-3 Thermographic Inspection InvolveHow Are Solar Panel Faults Found Using Thermal Drone Imaging, Commercial Rooftop Solar Inspection In The West Midlands, What Does An IEC 62446-3 Thermographic Inspection Involve
Solar PV Thermographic Inspection of a West Midlands Distribution Centre Rooftop
~ Six classified findings on a 50 kWp rooftop array, one of them warranting investigation without delay ~
Why a working rooftop array needs a Level 3 thermographer, not just a thermal camera
Why a 50 kWp Rooftop Solar Array Needed a Thermographic Inspection
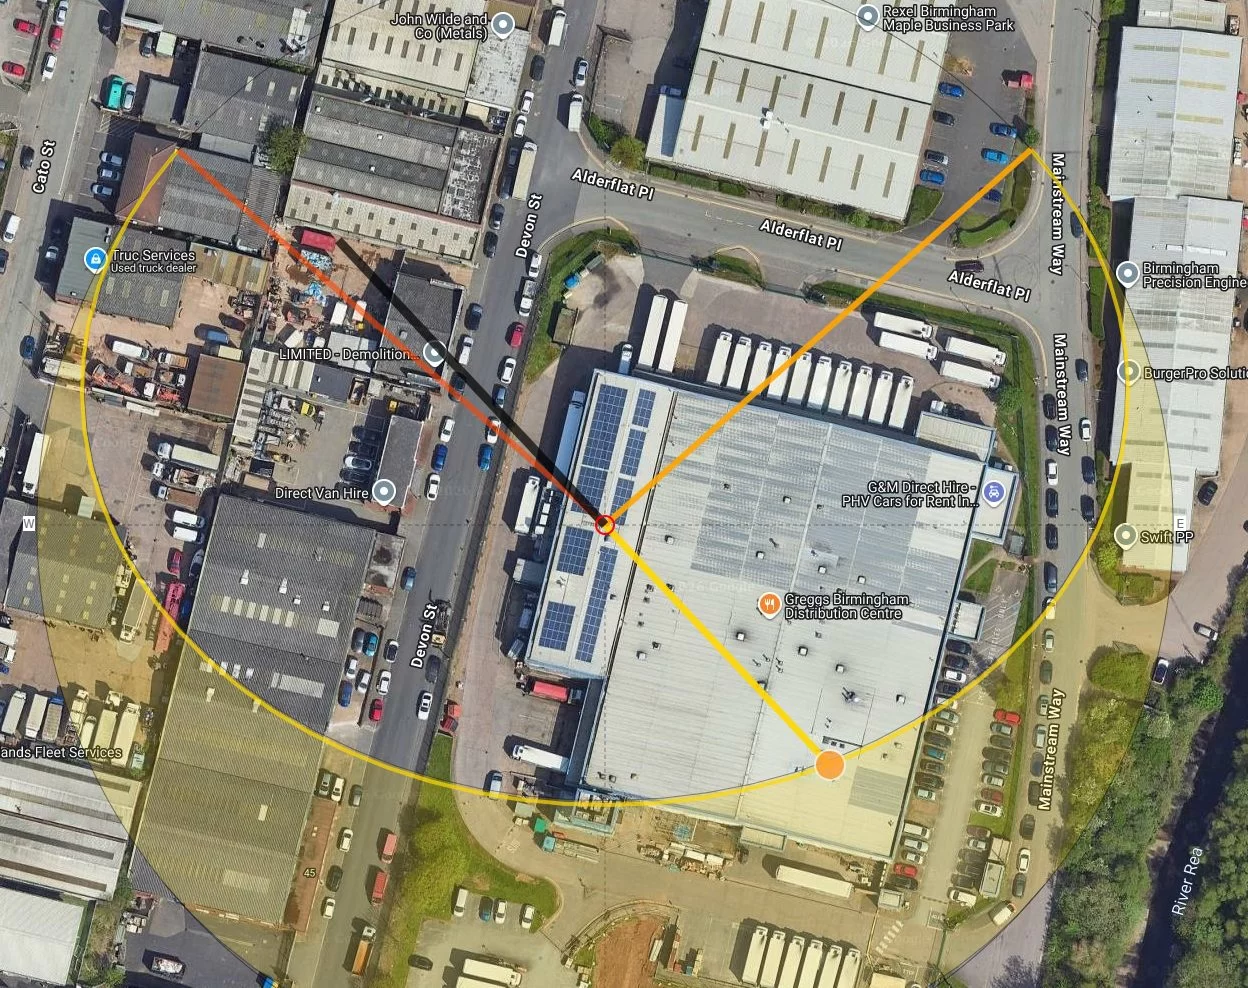
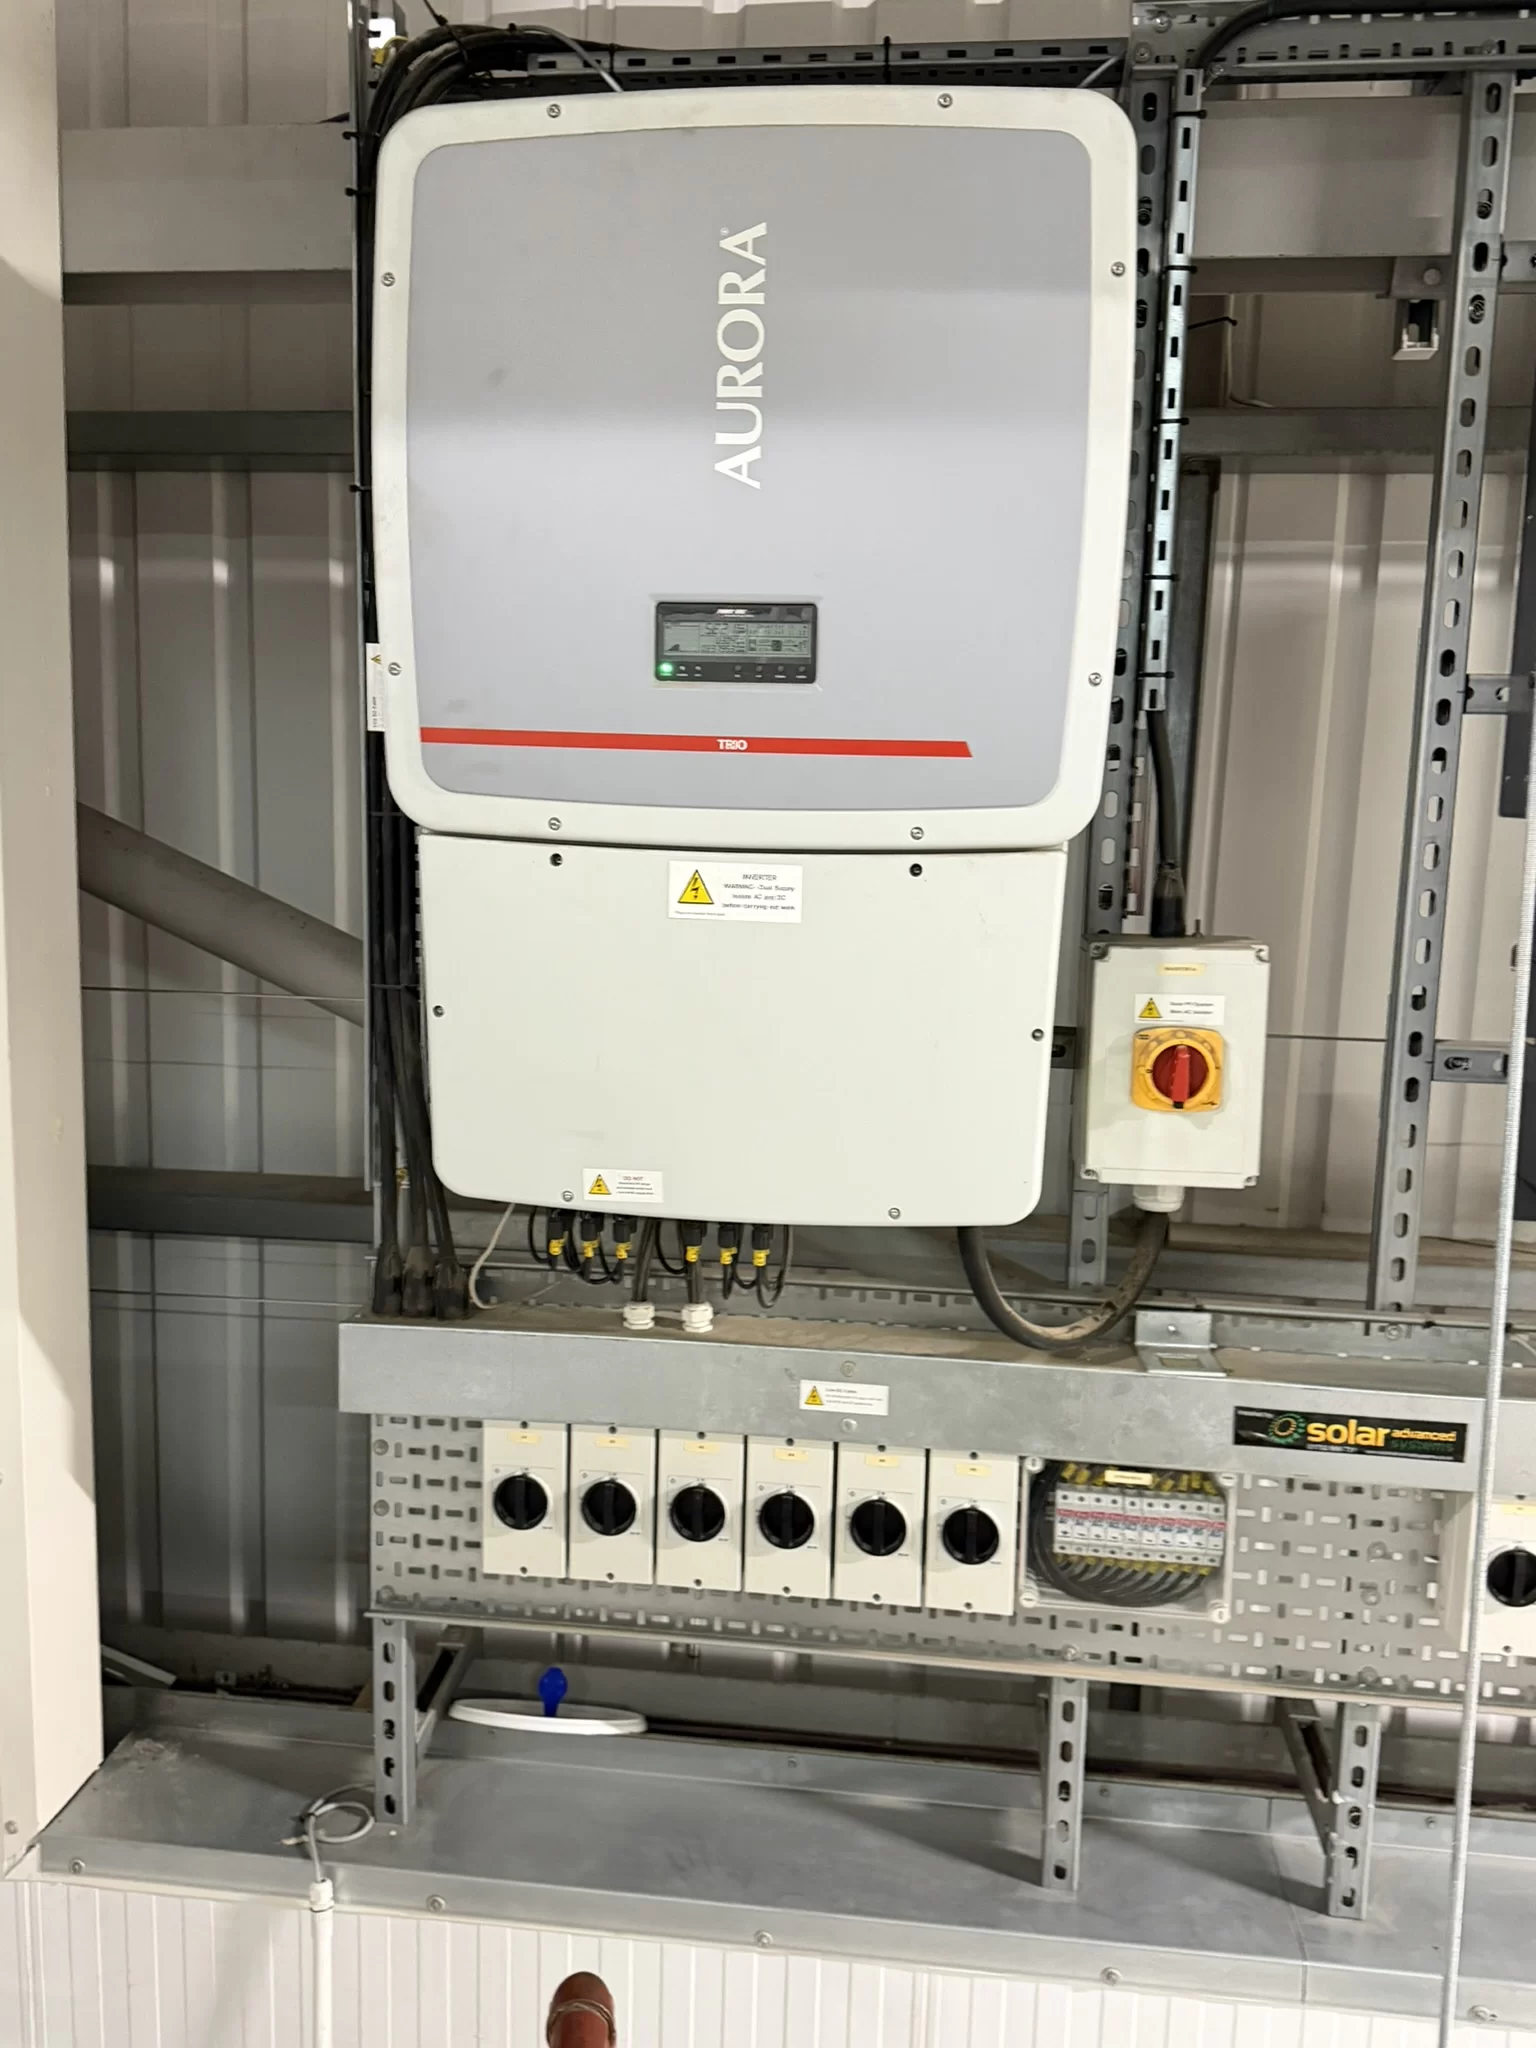
A large food distribution centre in the West Midlands carries a 50 kWp photovoltaic array across its roof, 200 modules arranged in a single zone and served by two inverters. Arrays like this one are easy to forget about. They sit above a busy operational site, they are awkward to reach, and unless the inverter monitoring throws an obvious alarm they are assumed to be working. The electrical contractor responsible for the installation commissioned a solar PV thermographic inspection to establish what the array was actually doing, rather than what it was assumed to be doing.
The reason thermography answers that question is physics rather than optics. A photovoltaic cell converts most of the light landing on it into electricity. When a cell or a string cannot do that, the energy does not disappear, it is dissipated as heat instead. A module that has stopped contributing therefore runs measurably warmer than its healthy neighbours, and a faulty cell within an otherwise healthy module runs warmer still. The thermal signature is not a side effect of the fault. It is the fault, made visible.
Reading those signatures reliably is the difficult part, and it is where the Level 3 analysis stage earns its place. A warm patch can be a genuine electrical fault, a reflection of the sky, a difference in soiling, or an artefact of the angle the image was taken from. Separating those requires a controlled baseline, correct radiometric parameters, and an analyst who knows which patterns mean what. The capture, the analysis and the reporting for this array were all delivered by Drone Media Imaging.
Governing Standards
- IEC 62446-3:2017 The governing standard for photovoltaic system thermographic inspection. It sets the operating conditions under which a survey is valid, including minimum irradiance, maximum wind speed and cloud stability, and it defines the simplified qualitative inspection applied to this array.
- ISO 18436-7 The competency framework for thermographic condition monitoring personnel, and one of the frameworks our Level 3 Master Thermographer’s certification aligns with. It underpins the analysis and classification stage rather than the capture itself.
How was the solar PV thermographic inspection carried out?
How Was the Solar PV Thermographic Survey Carried Out Under IEC 62446-3?
IEC 62446-3:2017 does not simply ask for thermal images of solar panels. It sets the conditions under which those images mean anything. The array has to be working hard, so irradiance must be at least 600 watts per square metre. The wind has to be light, because moving air cools modules and washes out the very temperature differences the survey is looking for. Cloud must be stable, since a passing shadow changes what every module is doing from one moment to the next.
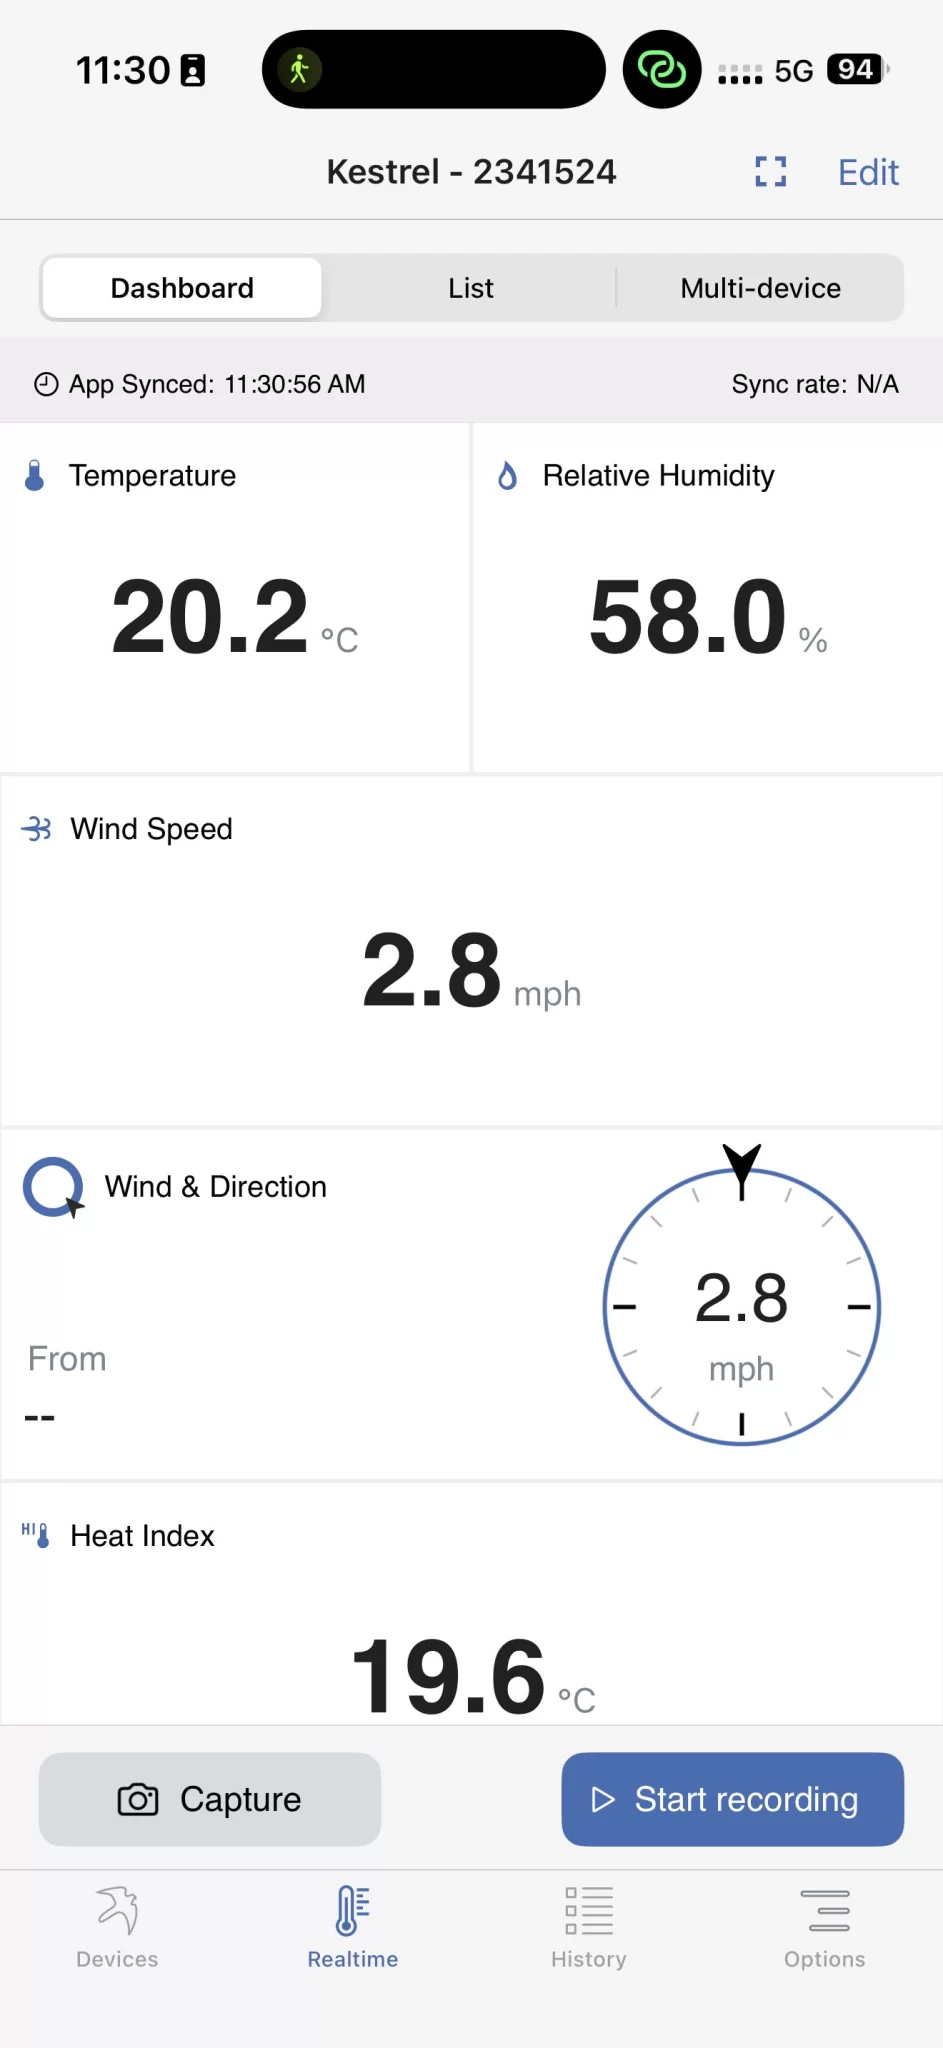
This survey was flown in the middle of a clear July day, inside a two hour window either side of solar noon so the array sat under sustained high irradiance at a consistent solar geometry. Irradiance, wind speed, humidity and cloud cover were logged continuously throughout by a calibrated weather meter and an IEC-compliant irradiance meter, and every one of them sat inside the standard’s limits with margin. Detailed thermograms were captured at 20 metres above the module surface, with overview imagery from higher up for orientation.
Each anomaly was then measured against a clean, uniformly irradiated reference module within the same thermogram, a baseline referred to as EL1. Comparing like with like inside a single image is what strips out the environment: whatever the ambient conditions were doing, the reference module was doing it too. A module twenty degrees above the air temperature means nothing on its own, because on a clear July day every healthy module on that roof is well above air temperature. A module several degrees above its own neighbours, measured in the same image under the same sun, means a great deal.
- Included: full thermal coverage of the accessible module population, radiometric analysis, Level 3 classification and a certified report.
- Not included: electrical testing, intrusive investigation, cable tracing, and any remedial or corrective work.
What did the solar PV thermographic inspection find?
Six findings were classified across five thermograms. They divide into three quite different problems, which is a useful reminder that a single number for array health tells an asset owner very little.
The most serious is a single cell on one module, classified High severity with a Safety consequence. The absolute temperature recorded there exceeds the threshold at which structural fire risk is treated as credible on a commercial roof, and that is a mandatory Safety trigger regardless of anything else. The thermal shape is that of a cell-level shunt, where a low resistance path develops across the cell’s junction, the cell stops generating, and it dissipates the energy its neighbours are producing as heat instead.
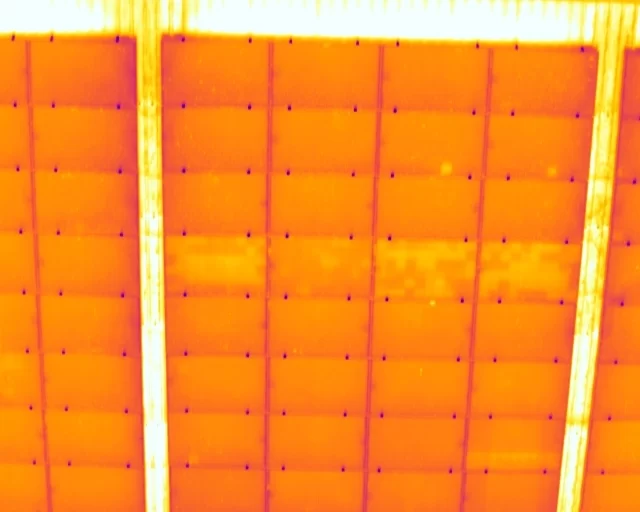
The largest is a contiguous block of twenty modules running warm as a unit, with no cell-level detail inside it. That uniformity is the diagnostic point. It is not consistent with a cell fault, it is consistent with a string not delivering power to its inverter, because when no work is extracted the incident solar energy is dissipated rather than converted. It is classified Medium severity with a Yield consequence: those modules were generating nothing at the time of survey.
Three further cell-level findings and one surface shading anomaly are classified Degradation Trajectory. None is an immediate safety concern, but each is a mechanism that characteristically develops.
What did the asset owner actually get?
Severity on its own does not tell anyone what to do. A cell running hot and a string generating nothing are both problems, but they are different kinds of problem with different urgencies and different costs of delay. That is why every finding in a Drone Media Imaging report carries a Consequence Classification alongside its IEC 62446-3 severity, translating the thermal magnitude into operational meaning.
Safety means a credible risk to building fabric or installation safety, and it is escalated on its own merits. Yield means measurable output is being lost now. Degradation Trajectory means the mechanism is likely to progress, and the finding warrants reassessment at the next inspection rather than action today. On this array that produced a clear order of work from six findings that would otherwise have looked like a flat list.
The deliverable was a certified report signed off by our Level 3 Master Thermographer, with an annotated thermogram for every classified finding, its grid position on the array, its measured temperatures, and a plain explanation of what the pattern indicates.
- Investigate the Safety-classified cell without delay, ahead of the other findings.
- Investigate the non-generating block of twenty modules, where output is being lost continuously.
- Reassess the four Degradation Trajectory findings at the next periodic inspection.
- Refer all classified findings to a suitably qualified electrical contractor for investigation.
The report also gives the site a dated thermal baseline. The next inspection will not start from nothing, it will start from this one, and that comparison is where slow degradation becomes visible.
One finding we could not name
One module carried a discrete, sharply bounded mark producing a mild thermal elevation. It was translucent, the cell structure still legible through it, which rules out bird fouling, an adherent deposit of that kind being opaque. Beyond that the evidence did not support naming a cause, so none was offered. It was classified on what could be measured, recorded for reassessment, and left there. Reporting the limit of what the evidence supports is part of the discipline, not a gap in it.
Do you know what your rooftop array is actually doing?
Drone Media Imaging delivers IEC 62446-3:2017 solar PV thermographic inspections, from drone capture through to certified Level 3 analysis and reporting, all under one roof. We cover Sussex, Hampshire, Kent and Surrey as standard, and travel throughout the UK, Ireland and Europe. If you own or maintain a commercial array and want to know where the faults are before they find you, we would be glad to talk it through.