Thermal Image or Thermal Measurement
Every thermal camera produces two things at once, and they are easily confused. One is an image, a false-colour rendering of the infrared radiation reaching the lens. The other is a measurement, a temperature figure attached to a point or an area within that image. The first is always available. The second is only available when the conditions for it were set correctly at the moment of capture, and it cannot be recovered afterwards if they were not.
That distinction decides whether a survey produces evidence or decoration. A camera does not read temperature directly. It reads radiant energy, and it converts that energy into an apparent temperature using values the thermographer supplies: how efficiently the surface emits, how much radiation from the surroundings is reflecting off it into the lens, and what the air between the camera and the target is doing to the signal on its way. Change any of those inputs and the number on the screen changes, while the picture looks identical.
This piece sets out what has to be true for a thermal figure to be defensible, why a false-colour palette is a presentation choice rather than data, and why a comparison between two points in one image is sturdier than either point read on its own. The conclusion is not that thermal imaging is unreliable. It is that a thermal picture, on its own, is not a measurement, and it should never be presented as one.
Blog Content TL;DR...
What a thermal camera actually gives you, and what has to be set before any of it counts as a measurement.
- A camera reports apparent temperature. The energy reaching the lens includes radiation reflected off the target, and whatever the air in between has done to the signal.
- Three inputs make it a measurement. Surface emissivity, the reflected apparent temperature of the surroundings, and the atmospheric path, all set at capture and none of them recoverable afterwards.
- The palette is a presentation choice. The same data rendered in greyscale, ironbow or rainbow looks like three different findings and is one dataset.
- Automatic scaling both flatters and hides. Left to itself the camera spreads the full colour range over whatever is in frame, so a trivial difference can look alarming and a real one can vanish.
- A comparison is sturdier than an absolute. Two regions of one image share the same errors, so the differential between them survives conditions in which no single absolute figure would.
An uncalibrated thermal picture is an observation. It becomes evidence only when the conditions it was taken under travel with it.
What the Camera Actually Measures
Apparent temperature, and the three inputs that correct it
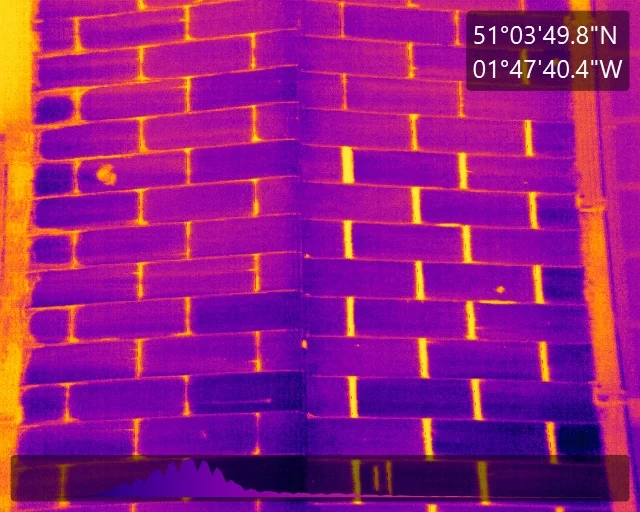
The camera reports apparent temperature, not temperature
An infrared camera detects radiant energy arriving at its detector and converts it to a temperature. The difficulty is that the energy arriving at the lens is not all emitted by the target. Some of it is emitted by the surroundings and reflected off the target towards the camera, and some of what the target did emit is absorbed or added to by the air along the path. Without correction, what the camera displays is apparent temperature, a figure that is true about the radiation and not necessarily true about the surface.
Three inputs turn apparent temperature into a measurement
The first is emissivity, the ratio of the radiation a surface emits to that of a perfect emitter at the same temperature. It is the single most influential correction, because an incorrect value biases every figure read from that surface. Most building fabric, paint, plastics, render, brick and timber sit at roughly 0.90 to 0.97, which is forgiving. Bare, polished and shiny metals often sit below 0.10, where the surface emits very little and reflects almost everything, so the apparent temperature is dominated by whatever the surroundings are doing.
The second is the reflected apparent temperature, the single equivalent temperature standing in for everything reflecting off the target into the lens. Outdoors under a clear sky that value can sit around minus 30 °C, far below anything else in the scene, and on a low-emissivity surface a careless setting turns a real finding into no finding at all. The third is the atmospheric path, the distance, air temperature and relative humidity between camera and target, which attenuates the signal and adds to it. All three are set at capture, recorded, and held consistent across a project, and none of them can be recovered later from a picture.
why a thermal image is not a temperature measurement | what emissivity and reflected temperature do to a thermal reading | why an auto-scaled thermal image can misleadwhy a thermal image is not a temperature measurement | what emissivity and reflected temperature do to a thermal reading | why an auto-scaled thermal image can mislead
The Picture Is a Presentation, Not the Data
Colour is a choice, and it is not part of the reading
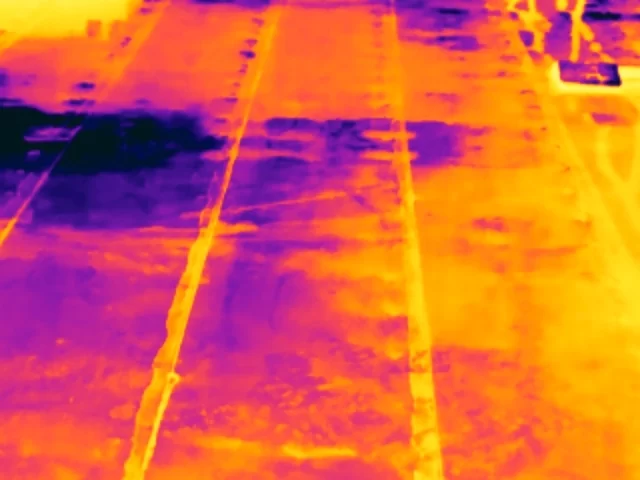
A thermal detector produces a single value per pixel. Turning that grid of values into something a person can look at means mapping each value to a colour, and the map chosen is arbitrary. The same capture rendered in greyscale, in an ironbow palette or in a rainbow palette produces three pictures that look nothing alike and contain exactly the same data. A palette is chosen for legibility, because the human eye separates some colour sequences better than others, and nothing about that choice makes a finding more or less real.
Automatic scaling is why two images cannot be compared by eye
More consequential than the palette is the range the colours are spread across. Left to itself a camera stretches the palette between the coldest and hottest pixels in the frame, so the full colour range is used on whatever happens to be in view. On a scene with almost no thermal variation, that stretch will amplify a fraction of a degree into a vivid red patch on a blue field, which looks alarming and means very little. Point the same camera at a scene containing one genuinely hot component and the scale widens to accommodate it, so everything else, including a real developing fault, flattens into uniform colour and disappears.
This is why a thermogram presented without its scale, its parameters and its context is not evidence of anything. Two images of the same asset on the same afternoon can tell opposite stories purely through the range each was scaled to. Reporting sets the span deliberately and states it, so that what the reader sees corresponds to the figures in the table beside it rather than to the camera’s own convenience.
What Makes a Reading Defensible
A same-image differential cancels most of the error
The parameters that make an absolute figure difficult are largely shared between two regions of one image. Emissivity, reflected temperature, distance and the atmospheric terms apply almost equally to a component and to a comparable component captured in the same frame, so comparing the two cancels most of the common error rather than compounding it. That is the reason a differential between a suspect item and its neighbour resolves well below the absolute accuracy the camera can claim for either figure alone. The arithmetic that makes an absolute reading fragile is precisely what makes the comparison robust.
The record is part of the measurement
A figure without its conditions is not a measurement, it is a number. The emissivity used, the reflected apparent temperature, the distance, the air temperature and the relative humidity all belong with the reading, and they are held consistent across a project so that a value captured on the second day can legitimately be compared with one from the first. Change the parameters between visits and the trend disappears into the method. This is also why some warm areas are excluded rather than reported: a bright metal bracket or a cable tie can read warm purely through its emissivity, and naming it as an artefact is part of the analysis rather than an omission from it.
None of this makes thermal imaging fragile. It makes it a discipline with preconditions, in the same way that any instrumented measurement has them. The practical test for anyone receiving a thermal report is simple: does each figure arrive with the conditions it was taken under, is the scale on each image stated, and are findings framed as areas warranting further investigation by a suitably qualified contractor rather than as verdicts the picture cannot support.
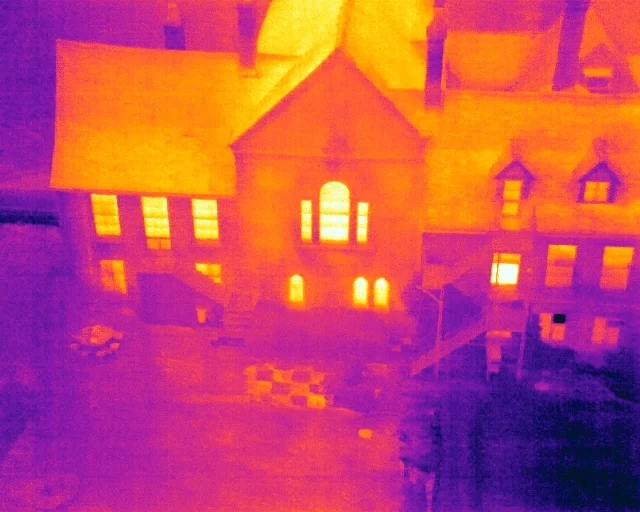
Reflected apparent temperature is determined before capture, not estimated afterwards. The recognised methods set the camera to an emissivity of 1.00 and a distance of zero, so that it reports apparent temperature with no correction applied, and then sample the radiation the target actually sees. The reflector method places a crumpled and re-flattened aluminium foil target, matt side out, in the same plane and orientation as the target, slightly de-focused, and takes the average over a large area box. The direct method turns the camera away from the target and averages the surroundings the target is reflecting, masking any single dominant hotspot. Outdoors the dominant reflected source is often the sky, so the determination is made away from the sun and logged with its time and method. The captured value is then entered alongside the correct emissivity, the actual distance, the air temperature and the relative humidity, and all of them are recorded and held consistent for the duration of the project.
Governing Standards and Frameworks
- ISO 18434-1:2008, Condition monitoring and diagnostics of machines, Thermography, Part 1: General procedures. Sets out determining and compensating for reflected apparent temperature, emissivity and attenuating media.
- EN 13187:1999, Thermal performance of buildings, qualitative detection of thermal irregularities in building envelopes. Applied where building fabric is the subject.
- IEC 62446-3:2017, Photovoltaic systems, outdoor infrared thermography of photovoltaic modules and plants. Applied where solar PV is the subject.
- ISO 18436-7:2014, ASNT SNT-TC-1A and ANSI/ASNT CP-105, the frameworks in accordance with which this work is practised, with BINDT CMGEN Appendix B as UK training governance.
- Certification. Work conducted by Steve Fisher, ITC Level III Certified Master Thermographer (Infrared Training Centre; Certification #205722059).
Discuss a Thermal Survey
Drone Media Imaging provides aerial and ground-based thermal survey, analysis and reporting across Sussex, Hampshire, Kent and Surrey, travelling throughout the UK, Ireland and Europe, and worldwide for thermography. Tell us the question you need answered and we will tell you what the imagery can and cannot support, and what conditions the work needs.
related posts
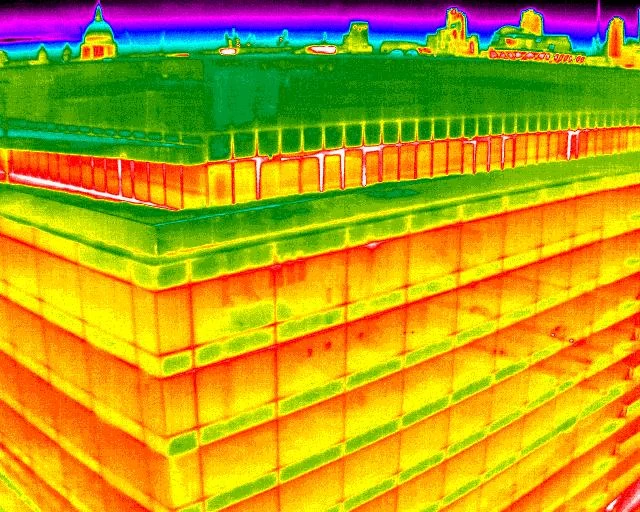
A building heat loss survey looks like a single cold night's flying, but most of what decides its value is settled beforehand. This piece sets out the information a thermographer needs from the building owner and why each answer changes how a thermal pattern is read, what has to be arranged before an after-dark survey of an occupied building, and what the finished report contains, including the difference between a certified inspection report and a professional opinion.

Quantitative and qualitative thermography are two essential methods in thermal imaging analysis. Quantitative thermography measures exact temperature values, while qualitative thermography focuses on pattern recognition. Both play a crucial role in building inspections, electrical fault detection, and industrial diagnostics. Understanding their differences helps professionals choose the right approach for accurate thermal assessments. Drone Media Imaging provides expert thermographic services, ensuring precise, reliable results. Contact us today for professional thermal imaging analysis.

Insurance companies can greatly benefit from embracing drone technology, particularly in the areas of claims assessment, risk prevention, and post-disaster response. Drones can quickly and accurately assess damage, provide risk mitigation recommendations, and aid in resource allocation during disasters.