
A Warm Patch on a Wall Is Not a Finding Until It Has Been Read
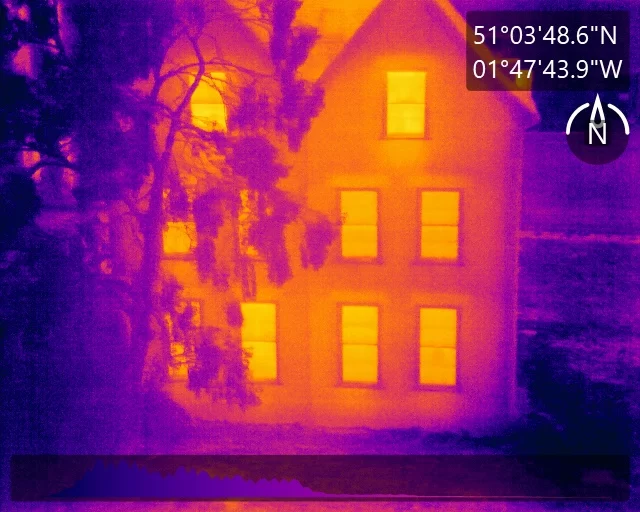
A thermal image of a building at night is striking, and it is tempting to treat every bright patch on it as a problem solved. It is not. The same warmer area on the outside of a wall can come from insulation that is missing or has slumped, from a thermal bridge, which is a structural element such as a lintel, a floor slab edge or a steel beam conducting heat straight through the insulation line, or from warm air leaking out through a gap. Three different causes, and three different conversations about what happens next.
That is why the picture is not the product. The value of a heat loss survey lies in the classification: deciding, for each anomaly, which of those causes the evidence points to, and saying so plainly. Get it wrong and the owner pays to put right something that was never the problem, while the real loss carries on through the winter.
This post explains how heat loss thermogram interpretation actually works. It covers what each pattern looks like and why, the things that make a surface look cold when it is not, and how Drone Media Imaging reads the shape of a pattern against the construction of the building rather than relying on the colour palette alone.
Blog Content TL;DR...
A heat loss survey earns its fee in the interpretation, not the image.
- Missing insulation, thermal bridges and air leakage can all show as warmer areas on the outside of a building.
- Each leaves a different shape: a diffuse patch within a bay, a sharp line that follows the structure, or a plume from a joint.
- Glass and bare metal can look cold because they mirror the night sky, so apparent temperature is read with caution.
- The pattern is read against how the building is built, which the drone’s view of every elevation and the roof makes possible.
- A wrong classification sends money to the wrong remedy, so every finding is classified before it is reported.
The colour tells you something is different. The shape tells you what.
Why One Warm Patch Has Three Explanations
Every route heat takes out of a building ends at the same outer surface

What the camera is actually seeing
On a cold, still night, heat flows steadily out through the walls and roof of a heated building. A thermal camera cannot see that flow. It sees only the outer surface, where the heat finally arrives and is lost to the air and the sky. A well-insulated wall lets very little through, so its outer face sits close to the temperature of the night air. Wherever more heat is getting out, the outer face reads a little warmer than the wall around it.
Three routes, one surface
Heat can reach that surface faster in three quite different ways. It can conduct through a part of the wall where the insulation is absent, thin or has slumped down inside a cavity. It can conduct through a structural element that is better at carrying heat than the insulation beside it, the thermal bridge. Or it can be carried bodily by warm air finding its way out through gaps, joints and openings. All three warm the outside of the building, and on a colour palette all three can look alike.
Why the distinction is the whole job
An untrained reading treats the warmest areas as the worst and stops there. That ranks anomalies by brightness, which partly reflects the conditions on the night, and says nothing about the cause. When an architect commissions a survey ahead of a renovation, or an owner wants to know where the heating budget is going, the useful answer is not where the building is warm. It is why, because the why decides who should look at it next.
Missing Insulation or Thermal Bridge, Reading a Heat Loss Thermogram, Air Leakage on a Thermal SurveyMissing Insulation or Thermal Bridge, Reading a Heat Loss Thermogram, Air Leakage on a Thermal Survey
Reading the Shape of the Pattern
Missing or slumped insulation
Where insulation is absent, the warmer area tends to fill a bay or panel and has soft, diffuse edges, because heat spreads sideways through the wall around the gap. Slumped cavity fill shows as warmth gathered towards the top of a wall section, where the material has settled away. Boards laid with gaps between them can leave a faint grid. The giveaway is that the pattern sits inside the structure rather than tracing it.
Thermal bridges
A thermal bridge does the opposite. It draws a sharp, often straight line that follows the building’s frame: along a floor slab edge at each storey, across the head of every window where a lintel sits, up a column or around a corner. Bridges repeat with the structure, so the same line appearing at the same position on every floor is strong evidence. That geometry is why the construction has to be understood before the image is read.
Air leakage
Escaping warm air leaves an irregular plume or streak from a joint, the eaves, a frame or a service penetration, usually spreading upwards and often uneven from one opening to the next. Because it depends on air pressure and wind, it can change between images taken minutes apart, which a conducted pattern does not. Seen from inside, the same leak shows as a cold draught path, which is where an internal survey adds weight.
When a surface lies
Glazing, polished metal flashings and some cladding reflect the cold night sky, so they can read colder than they really are. An apparent cold area on those materials is treated with caution, never reported at face value.
What a Correct Classification Saves
Each finding points to a different specialist
The reason classification matters is practical. An area read as missing or slumped insulation is a matter for an insulation contractor to investigate. A thermal bridge at a slab edge or lintel is usually a detail of the original design, and a question for an architect or energy assessor. Air leakage concerns the airtightness of joints and openings. Mistake one for another and the wrong person is sent, at the owner’s expense, to look at something they cannot resolve, while the actual loss continues.
How Drone Media Imaging reads a building
Every anomaly is located precisely on the elevation and read for its shape, its edges and its relationship to the structure behind it. The drone’s view of every face and the roof makes that comparison possible across the whole envelope, so a line that repeats floor by floor can be seen as one pattern rather than a dozen separate marks. Where more than one explanation remains possible, the report says so and states what further investigation would settle it, rather than forcing a verdict.
What you receive
The report sets out each finding with its location, its classification and the reasoning behind it, written for the person who has to act on it. Every finding is presented as an area warranting further investigation by a suitably qualified contractor. You can see how this works on a sensitive building in our Grade I listed thermal building survey, and the full service is set out on our commercial building heat loss survey page, part of our drone thermography services.

The heat passing through a building element is the product of its U-value, the rate at which it transmits heat per square metre for each degree of difference, and the temperature difference across it. On the outside, that heat must cross a thin boundary layer of air, the external surface resistance, conventionally taken as 0.04 m²K/W in heat loss calculations.
Because that resistance is small, a well-insulated wall’s outer surface sits only slightly above the outside air. Where the local U-value is higher, more heat arrives and the surface warms in proportion. A thermal bridge is a narrow strip of high U-value, so it appears as a narrow warmer line on an otherwise even face.
Heat loss calculations recognise this separately from the plain U-values of walls, roofs and windows, adding an allowance for thermal bridging known as the y-value. Wind thins the boundary layer and lowers the surface resistance, flattening every contrast, which is one reason surveys need still conditions.
Governing Standards
- BS EN ISO 6781-1:2023, Performance of buildings. Detection of heat, air and moisture irregularities in buildings by infrared methods. General procedures, the building envelope methodology with which this work is aligned.
- Thermographic inspection, analysis and reporting are conducted by Steve Fisher, ITC Level III Certified Master Thermographer (Infrared Training Centre; Certification #205722059), practising in accordance with the frameworks of ISO 18436-7:2014, ASNT SNT-TC-1A and ANSI/ASNT CP-105, and BINDT CMGEN Appendix B (UK training governance).
Commission a Building Heat Loss Survey
Drone Media Imaging carries out building heat loss survey, analysis and reporting across Sussex, Hampshire, Kent and Surrey, travelling throughout the UK, Ireland and Europe. Every anomaly is classified by a Level III thermographer before it reaches the report, so you know not only where your building is losing heat but why, and who should look at it next.
related posts

Drone Media Imaging invests in new cuttin-edge photobrapmmetry survey and inspection equipment with the new DJI M300RTK and P1 Suvery Grade Camera
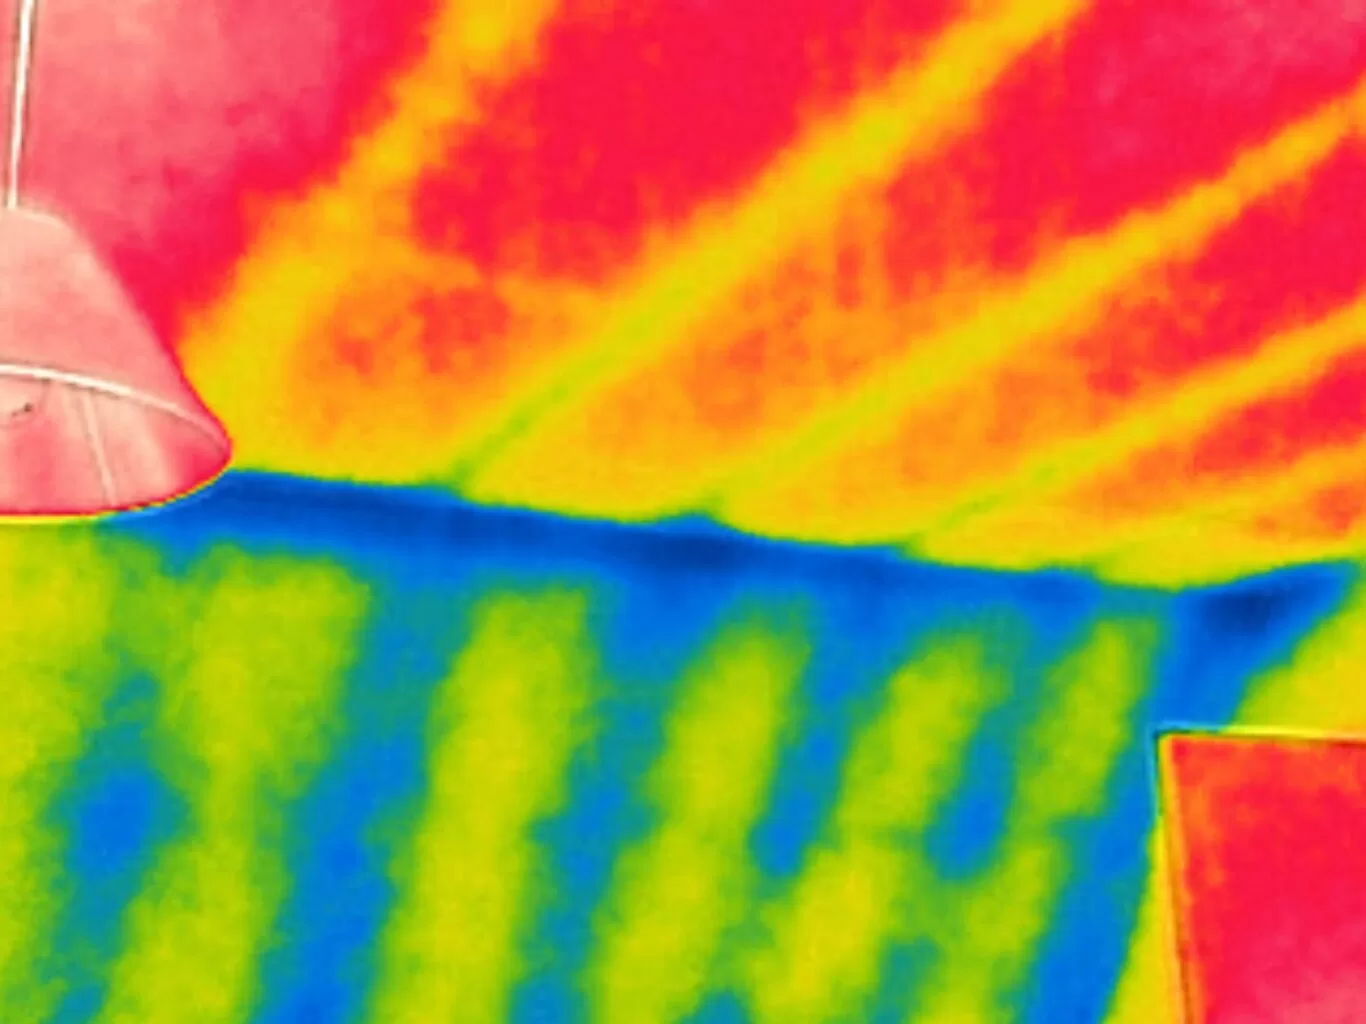
Level 3 thermography certification is the highest qualification for thermographers, focusing on advanced infrared inspection techniques, program management, and compliance. It prepares professionals to establish and oversee thermography programs across industries, ensuring accuracy and standardisation in inspections and reports
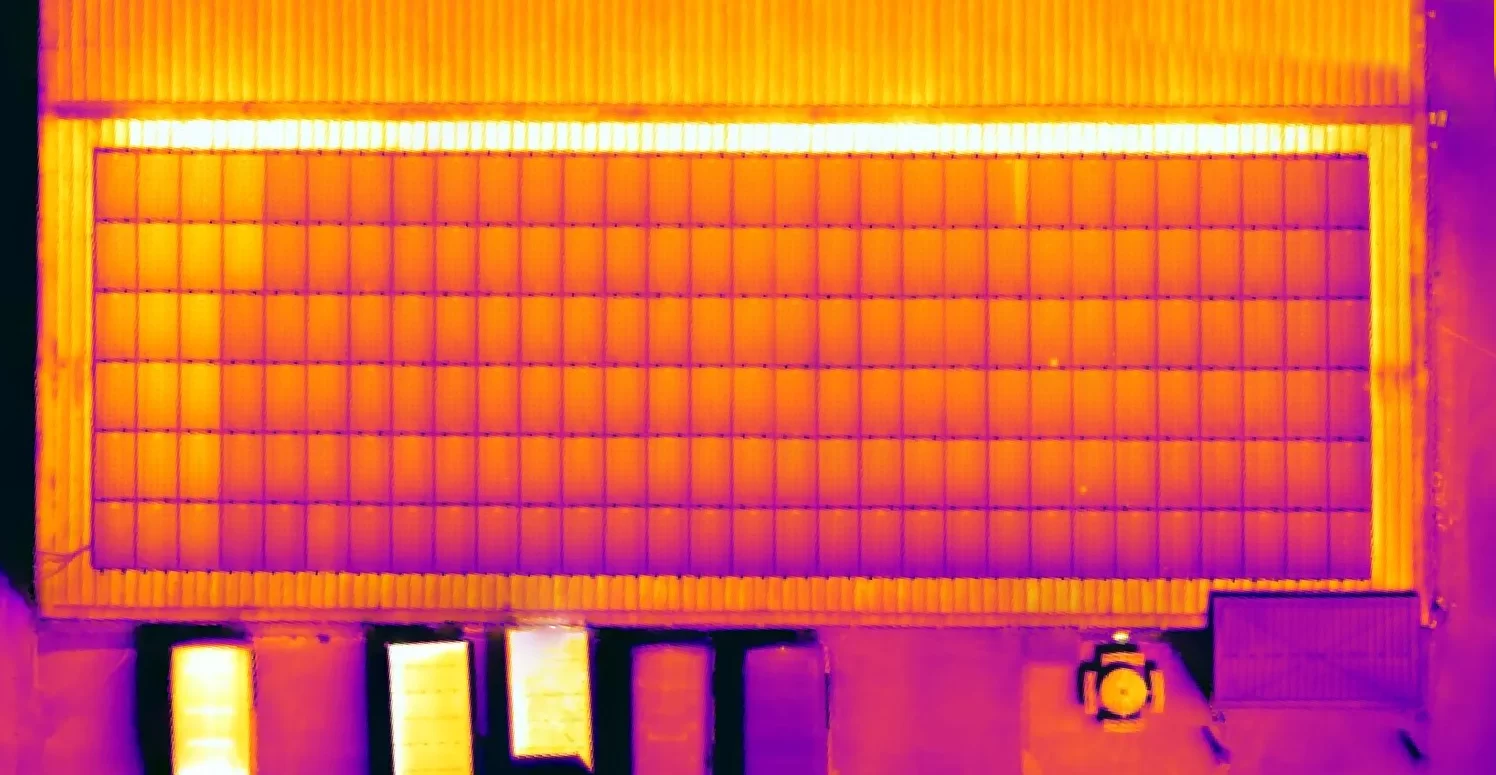
How often should a commercial solar array be inspected? The published guidance gives more than one answer. IEC TS 62446-3 recommends four years and defers to the owner, MIS 3002 points to a full maintenance visit every two years, and RC62, the UK insurers' own code of practice, recommends thermographic examination as part of the maintenance regime. This post sets out what each says, then what should decide the interval for a particular roof: age, history, fire load and change.