Solar PV Thermographic Inspection of an 804 Module Commercial Rooftop Array
What an IEC 62446-3 Solar Thermographic Inspection Reveals on a Commercial Roof
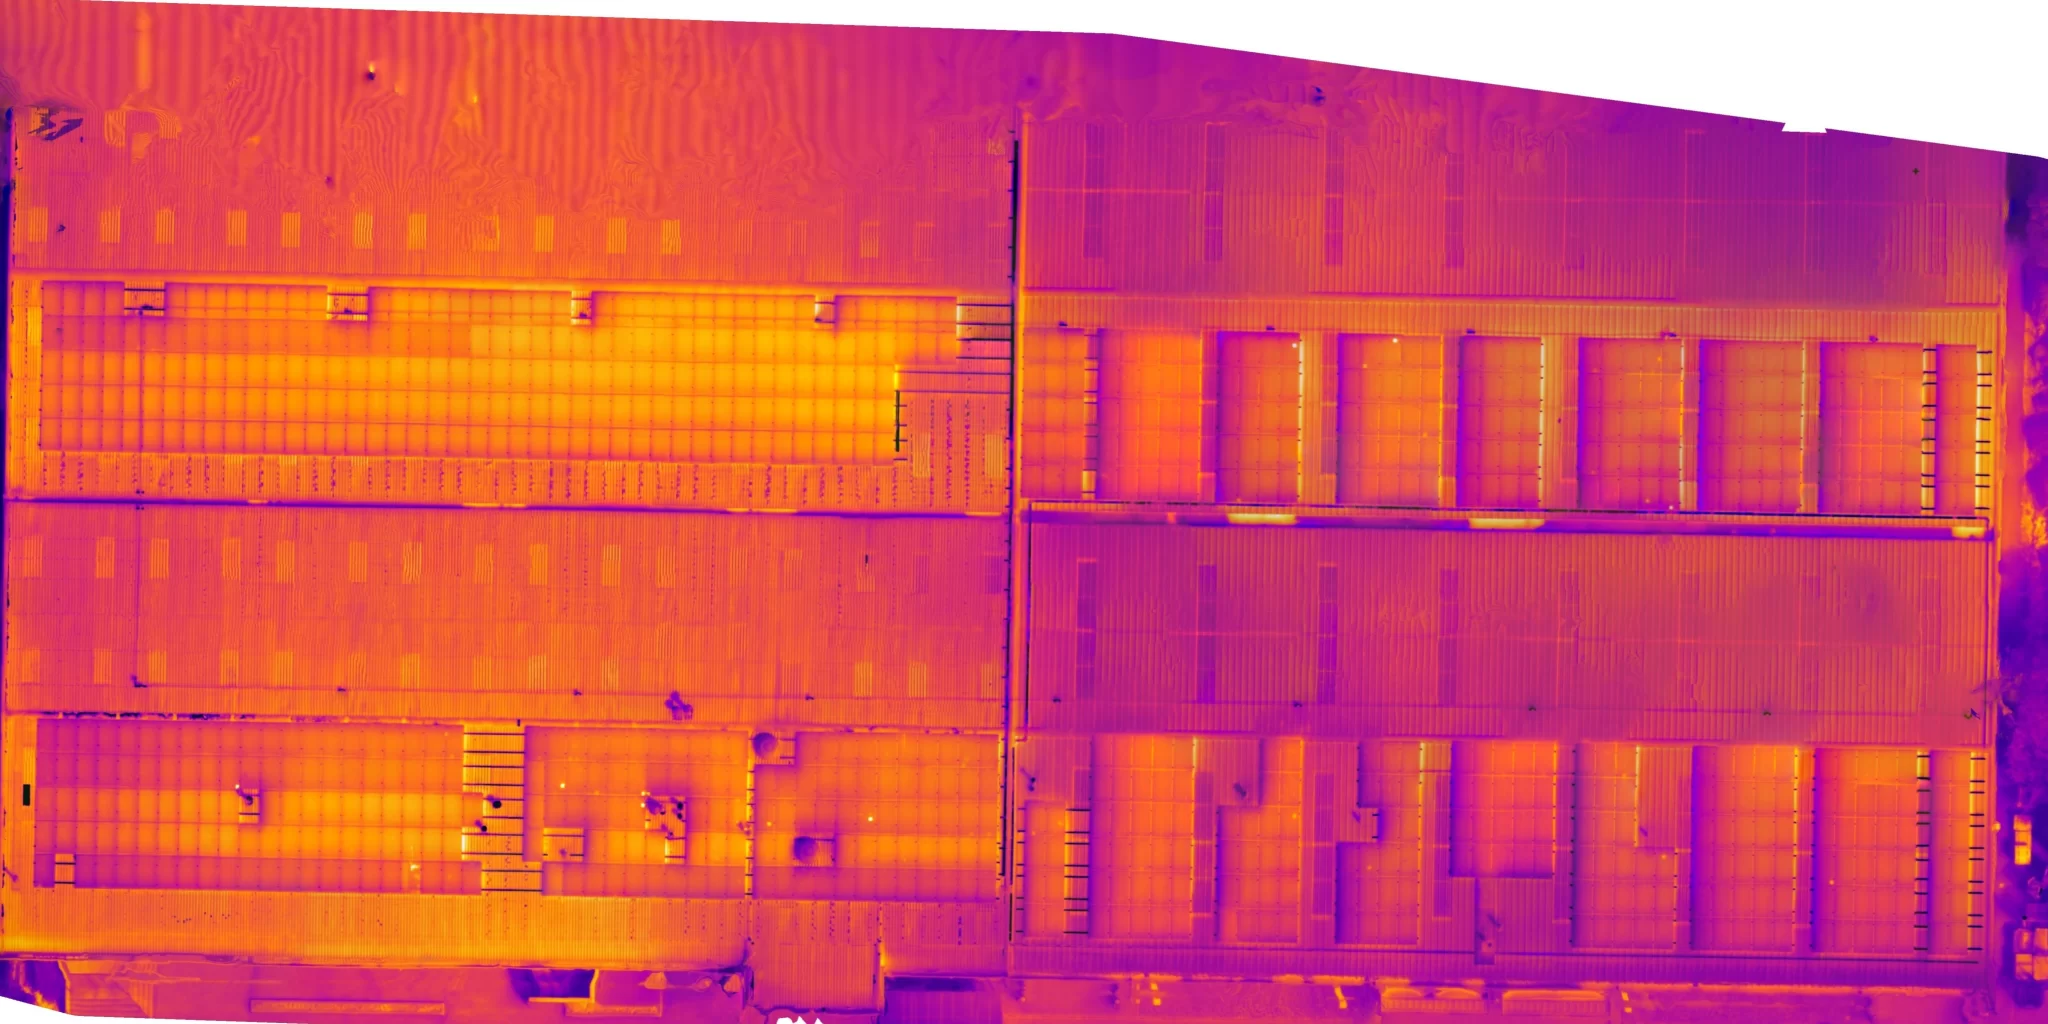
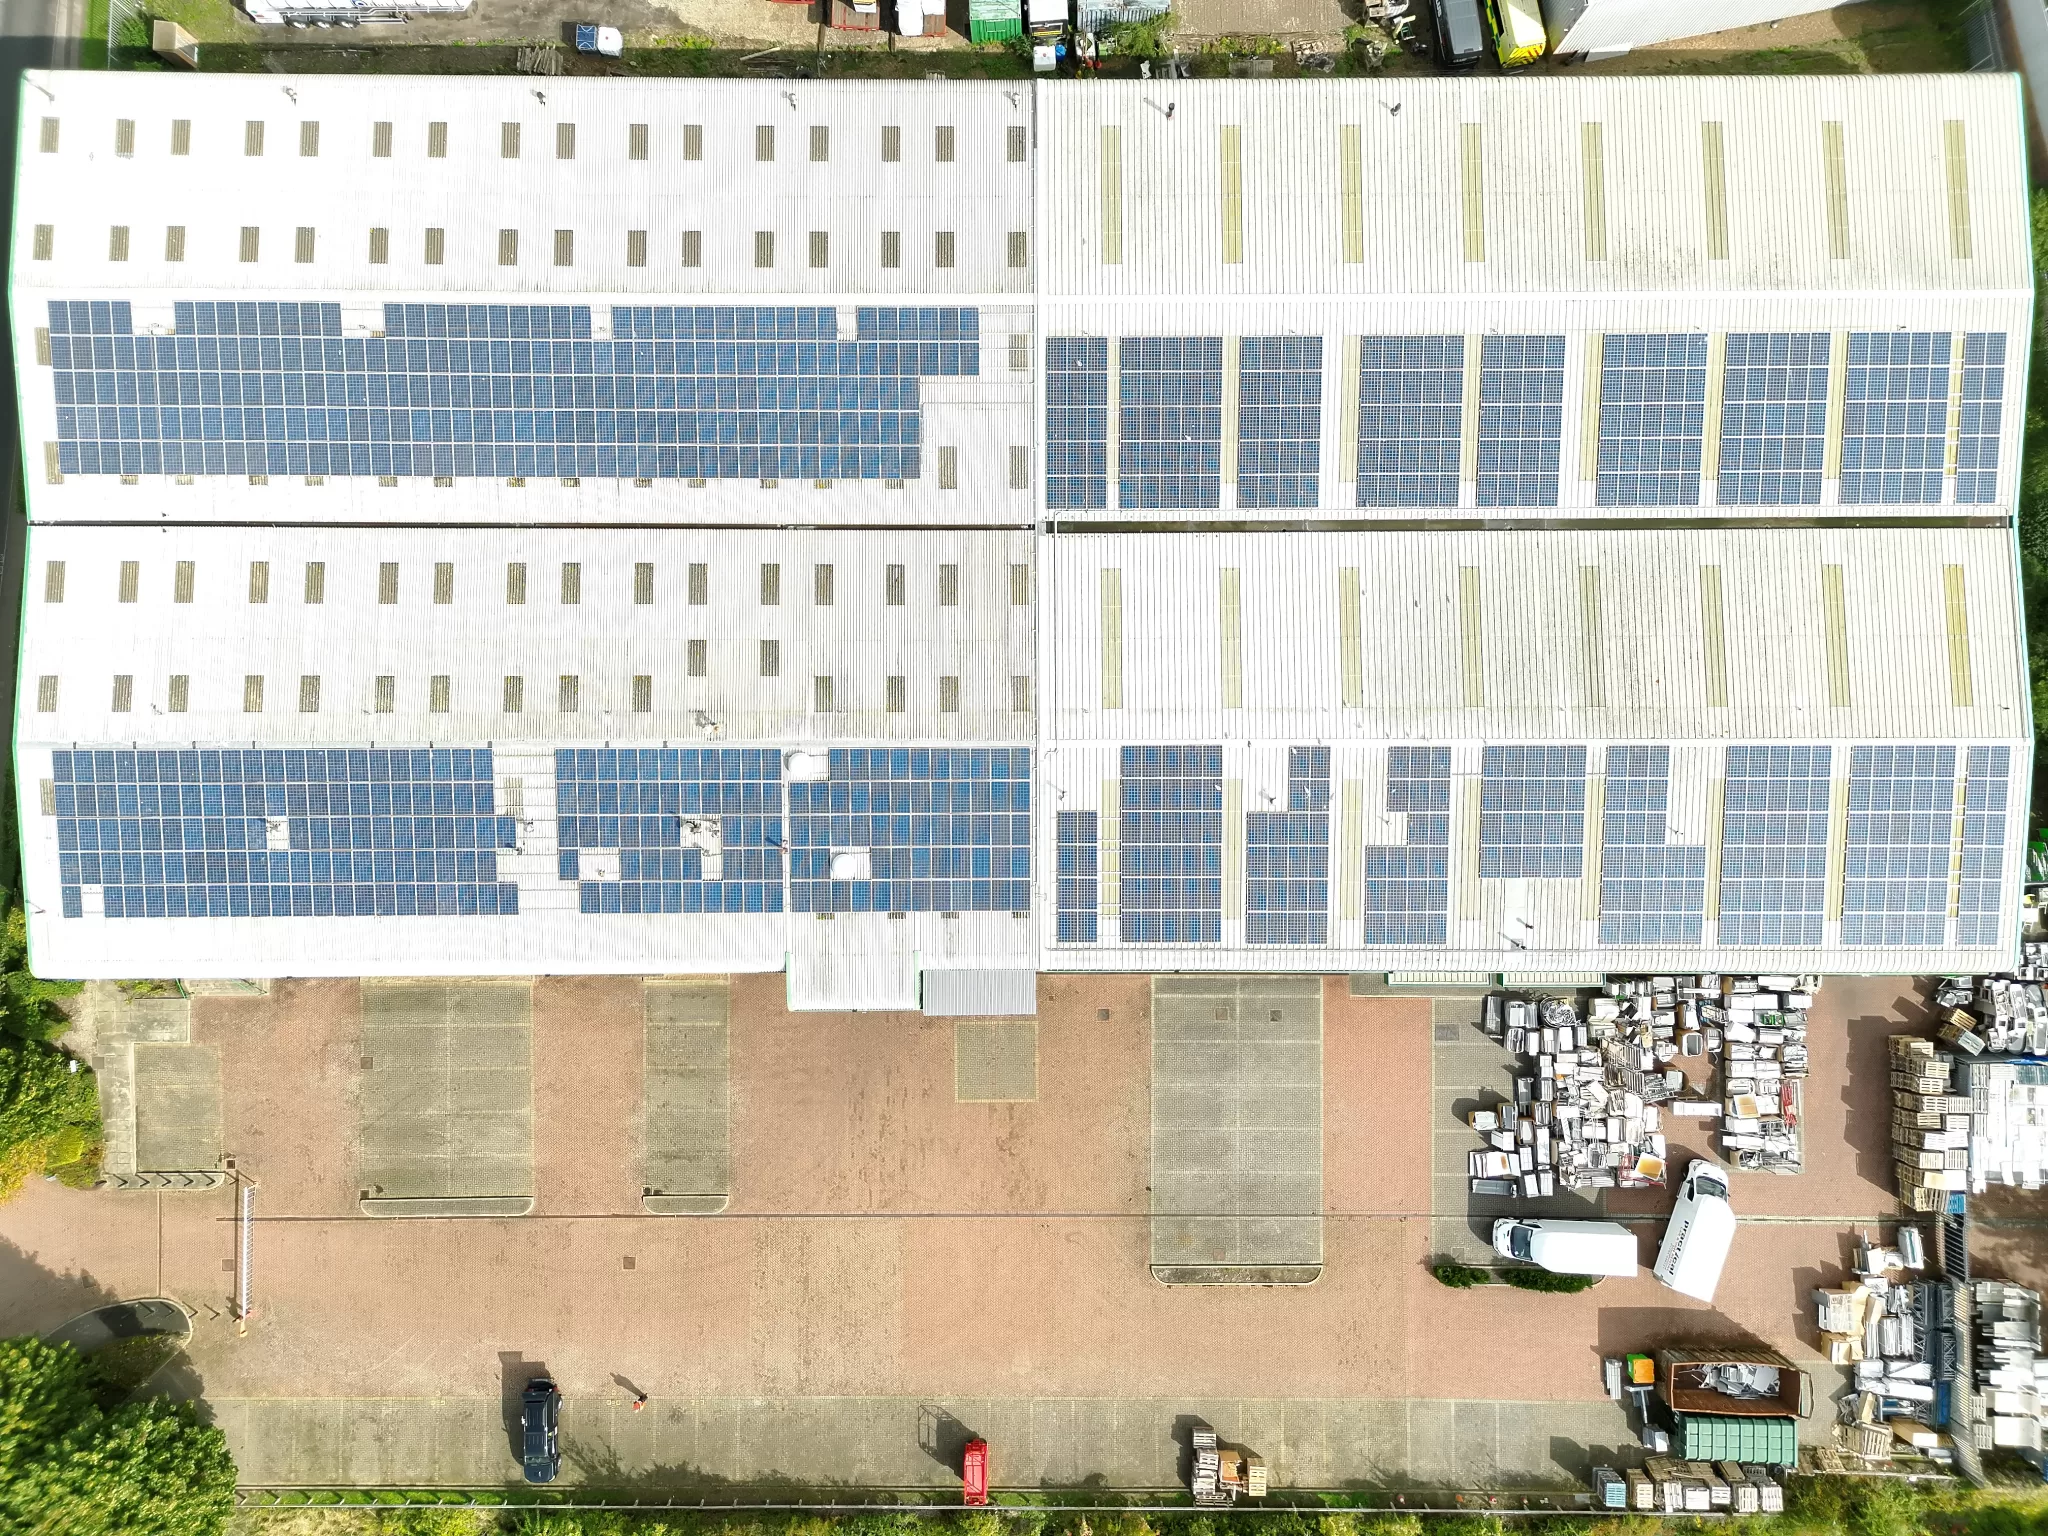
A commercial rooftop photovoltaic array in Kent, comprising 804 modules across four separate roof zones, was inspected as a detailed thermographic survey under IEC 62446-3:2017. The array was flown by drone at 20 metres above the module surface for detailed capture and 60 metres for overview imagery, within 35 minutes of solar noon, with in-plane irradiance between 871 and 908 W/m2 and wind averaging 1.3 m/s. Twenty-nine detailed thermograms were analysed by our Level 3 Master Thermographer, producing eighteen classified findings. Five were cell level anomalies reaching absolute temperatures between 80.8 °C and 91.4 °C, where localised heating becomes capable of degrading the encapsulant, and each was allocated the highest class of abnormality the specification provides. Separately, and covering far more of the array, two zones showed sustained uniform elevation across whole rows with no localised cellular structure. That presentation points to modules operating away from their maximum power point rather than to module defects, and carries a yield consequence. Bird droppings were identified on module glass in all four zones. The report set out each finding with its severity, consequence and class of abnormality for the owner’s contractor to investigate.
Project Overview
Subject
solar PV thermographic inspection, commercial rooftop solar array, Kent, solar asset owners and maintenance contractors, IEC 62446-3:2017
Skills Used
IEC 62446-3 Solar Thermographic Inspection, Solar Loading Analysis, Level 3 Report Writing
Portfolio Tags
solar pv inspection, aerial thermography, commercial rooftop solar, kent, iec 62446-3, drone thermal survey, level 3 thermographer, what does a hot solar panel mean
IEC 62446-3 Solar Thermographic Inspection, Aerial Drone Thermal Survey, Level 3 Thermographic AnalysisIEC 62446-3 Solar Thermographic Inspection, Aerial Drone Thermal Survey, Level 3 Thermographic Analysis
Solar PV Thermographic Inspection of an 804 Module Commercial Rooftop Array
~ Two conditions on one roof. One hot enough to matter, one large enough to cost. ~
Why a working rooftop array still needs looking at from the air
What an IEC 62446-3 Solar Thermographic Inspection Reveals on a Commercial Roof
The client is an electrical and renewables contractor in the South East, responsible for a commercial rooftop photovoltaic array on an industrial unit in Kent. The array is inspected twice a year, once in spring and once in late season, and this was the late season survey. That cadence exists because a rooftop array gives very little away from the ground. Inverter monitoring reports what a string is producing, but it cannot say which module is responsible, and a walk around the perimeter sees almost nothing of a roof plane.
Thermography closes that gap because a photovoltaic module that is not converting sunlight into exported current converts it into heat instead. Every module on a roof receives the same solar energy. What separates a healthy module from a compromised one is where that energy goes. A cell that has lost its ability to pass current is driven into reverse bias by its neighbours and dissipates their output as heat, showing as a localised hot spot. A module group that is not exporting at all warms uniformly across its whole area, because none of the incident energy is leaving as electricity. Those two signatures look entirely different in an infrared image, and they mean entirely different things.
This survey was commissioned as a solar PV thermographic inspection under IEC 62446-3:2017, carried out and reported by Drone Media Imaging, a trading name of VisualChaos Studios Ltd. The work was Survey, Analysis and Reporting only. No remedial or corrective work was undertaken, and no electrical testing formed part of this inspection.
Governing Standards
- IEC 62446-3:2017 The specification for thermographic inspection of photovoltaic systems. It sets the environmental conditions a survey must be flown in, the measurement approach, and the classification of thermal abnormalities against its twelve example conditions.
- ISO 18436-7:2014 The international framework for thermographic condition monitoring competence, applied here as an alignment framework for how the analysis and reporting were carried out.
How was the thermographic survey carried out?
Aerial Thermal Survey of a Four Zone Rooftop Solar Array in Kent
IEC 62446-3:2017 is specific about the conditions a thermographic survey may be flown in, because the method depends on the array being under meaningful load. Too little sunlight and a fault does not generate enough heat to separate from its surroundings. Too much wind and convection carries that heat away before the sensor sees it. The specification sets a floor of 600 W/m2 of in-plane irradiance and a ceiling of 7 m/s wind, and both were logged on site rather than taken from a forecast.
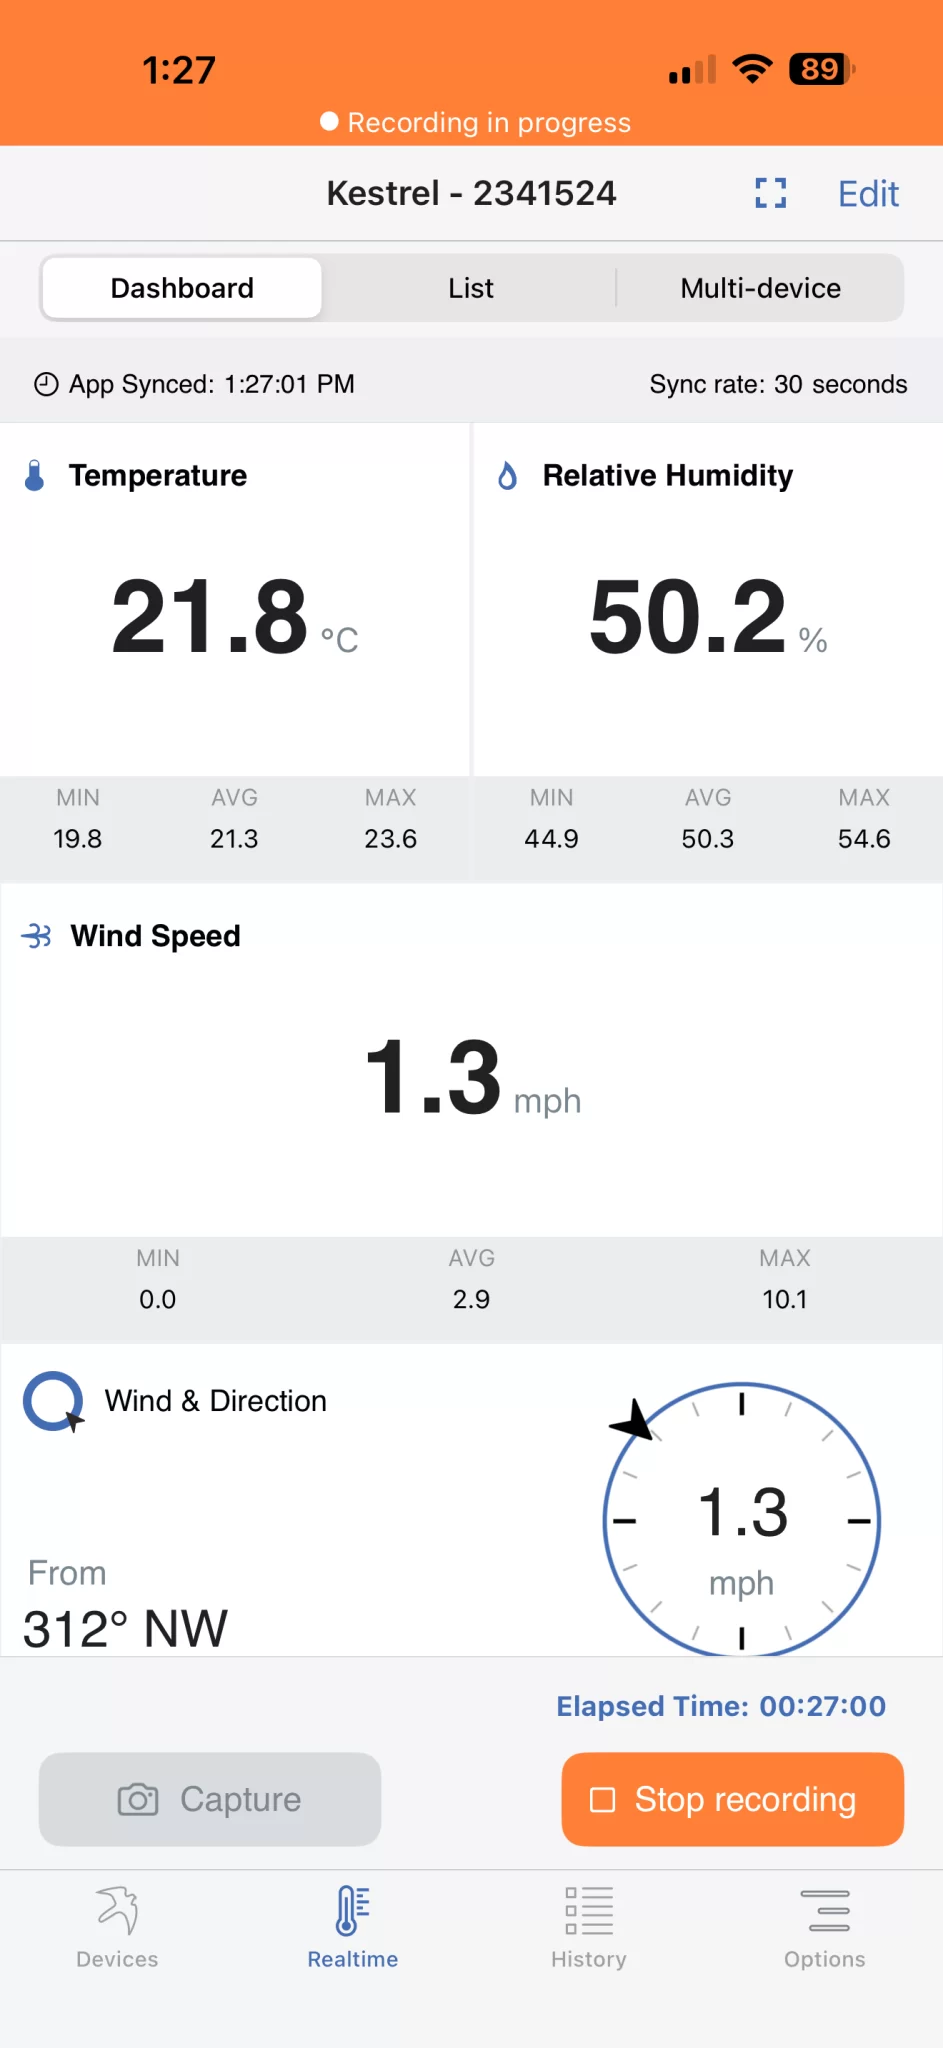
The survey was flown on a September afternoon inside a 35 minute window centred on solar noon, so that the sun sat high and close to the array normal for the whole capture. In-plane irradiance was recorded by a compliant reference cell at the start and end of each flight and held between 871 and 908 W/m2. Wind averaged 1.3 m/s with a peak of 3.5 m/s, and ambient temperature sat at 21.4 °C. Two flights were made, a detailed pass at 20 metres above the module surface and an overview pass at 60 metres for orientation imagery and the array control map.
Every thermogram was analysed against its own baseline rather than against a fixed temperature. A reference measurement was placed on a normally operating module within the same image, and each anomaly was assessed as a differential above that local baseline. This is what makes the method defensible: conditions drift across a roof and across a survey, and a differential taken from within a single image carries those conditions with it.
- Included: aerial thermographic capture of all module facing surfaces across four roof zones, Level 3 analysis and classification of every anomaly, an array control map, and a certified report
- Excluded: electrical testing, intrusive investigation, inverter diagnostics, on-roof electrical work, and any remedial or corrective work
What did the survey find?
Eighteen classified findings were reported across the four zones. They fell into two groups that are worth separating, because they warrant different responses on different timescales.
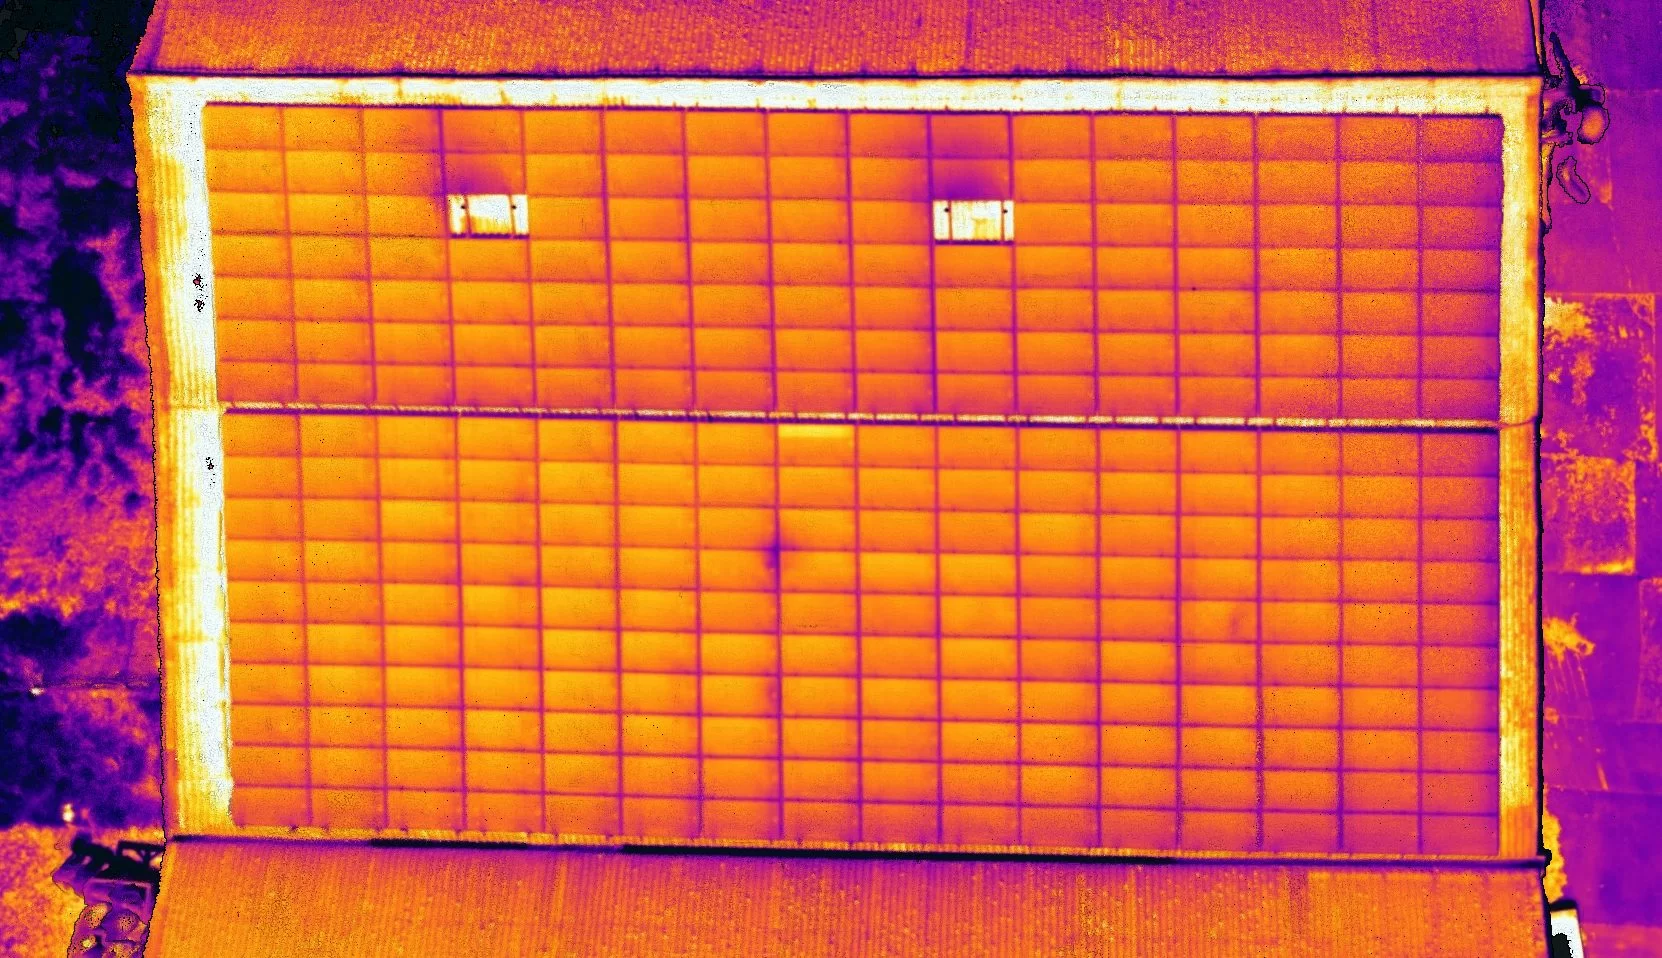
Five findings reached the absolute temperature thresholds this report treats as safety relevant, with maximum apparent temperatures of 91.4 °C, 90.3 °C, 87.5 °C, 84.5 °C, 83.1 °C, 82.3 °C and 80.8 °C. All were cell level anomalies, symmetrical and confined to a single cell, which points to a cell level electrical origin rather than anything sitting on the glass. At these temperatures the encapsulant behind the cell begins to degrade, and because degradation increases local resistance the condition can reinforce itself once established. Each was allocated Class of Abnormality 3, the highest the specification provides, and flagged for investigation without waiting for the next maintenance interval.
The second group covered far more of the array. Across two zones, whole rows presented sustained uniform elevation with no localised cellular structure anywhere within them. In one zone this ran the full width across two rows. In the other it covered the greater part of the zone, with only part of a single row presenting normally. This is the signature of modules operating away from their maximum power point rather than of ninety separate module defects, and it was classified as a yield condition at Class of Abnormality 2. The remaining findings were discrete cell anomalies of lower magnitude, recorded on a degradation trajectory for monitoring. Bird droppings were identified on module glass in all four zones.
What happens next?
The report was issued as a certified document signed by our Level 3 Master Thermographer, with each finding carrying three outputs: a severity band based on the measured differential, a consequence classification separating safety from yield from degradation trajectory, and the IEC class of abnormality. An array control map accompanied it, so that any finding can be traced from its thermogram to a specific module position by row and column.
Thermography identifies where to look, not what to do. The findings are areas warranting further investigation by a suitably qualified contractor, and the report says so plainly. The extended uniform elevation in particular is a question for string continuity and inverter operation rather than for the modules themselves, and that is where investigation should start if the yield loss is to be recovered.
- Investigate the five safety classified cell anomalies first, without waiting for the next scheduled maintenance
- Check string continuity and inverter operation for the two affected zones, where the yield loss is concentrated
- Arrange cleaning of the discrete deposits by a suitably competent party, avoiding abrasive or high pressure methods
- Retain the array control map so the next survey can be read against this one
Two surveys a year on a commercial roof is not over-inspection. It is what turns a thermal image into a trend, and a trend is what tells an owner whether a condition is stable or moving.
What made this survey unusual?
The inverter position was not accessible on the day, so the electrical architecture of the installation could not be established, and no module identification or manufacturer specification was available from any source. Both constraints were recorded in the report as stated limitations rather than worked around. Where manufacturer values are unavailable, comparison within the inspected population itself becomes the reference baseline, and saying so openly is part of what makes a thermographic report defensible rather than merely confident.
Considering a thermographic inspection of your solar array?
Drone Media Imaging is a trading name of VisualChaos Studios Ltd, delivering solar photovoltaic thermographic inspection under IEC 62446-3:2017, analysed and reported at Level 3. We work across Sussex, Hampshire, Kent and Surrey, travelling throughout the UK, Ireland and Europe, with thermography work undertaken globally. Survey, analysis and reporting, with findings classified for your own contractor to act on.