
Forestry Canopy Surveys
See the Whole Block at Once, and Again Next Year
Aerial mapping of woodland canopy across whole blocks, showing extent, cover and the condition of the crowns from directly above. Flown to a specification that can be reproduced, so a second visit measures real change rather than a different day. Used for disease spread, felling planning and extraction routes, post-works records, replanting and habitat recovery.
See the Whole Block at Once, and Again Next Year
Woodland is one of the hardest things to assess from the ground. Walking a hundred acres takes days, much of it is not walkable at all, and even where it is you are looking up at the underside of a canopy you cannot actually see. Disease spreads across the crowns, and the crowns are the one part of the wood nobody can get a proper view of.
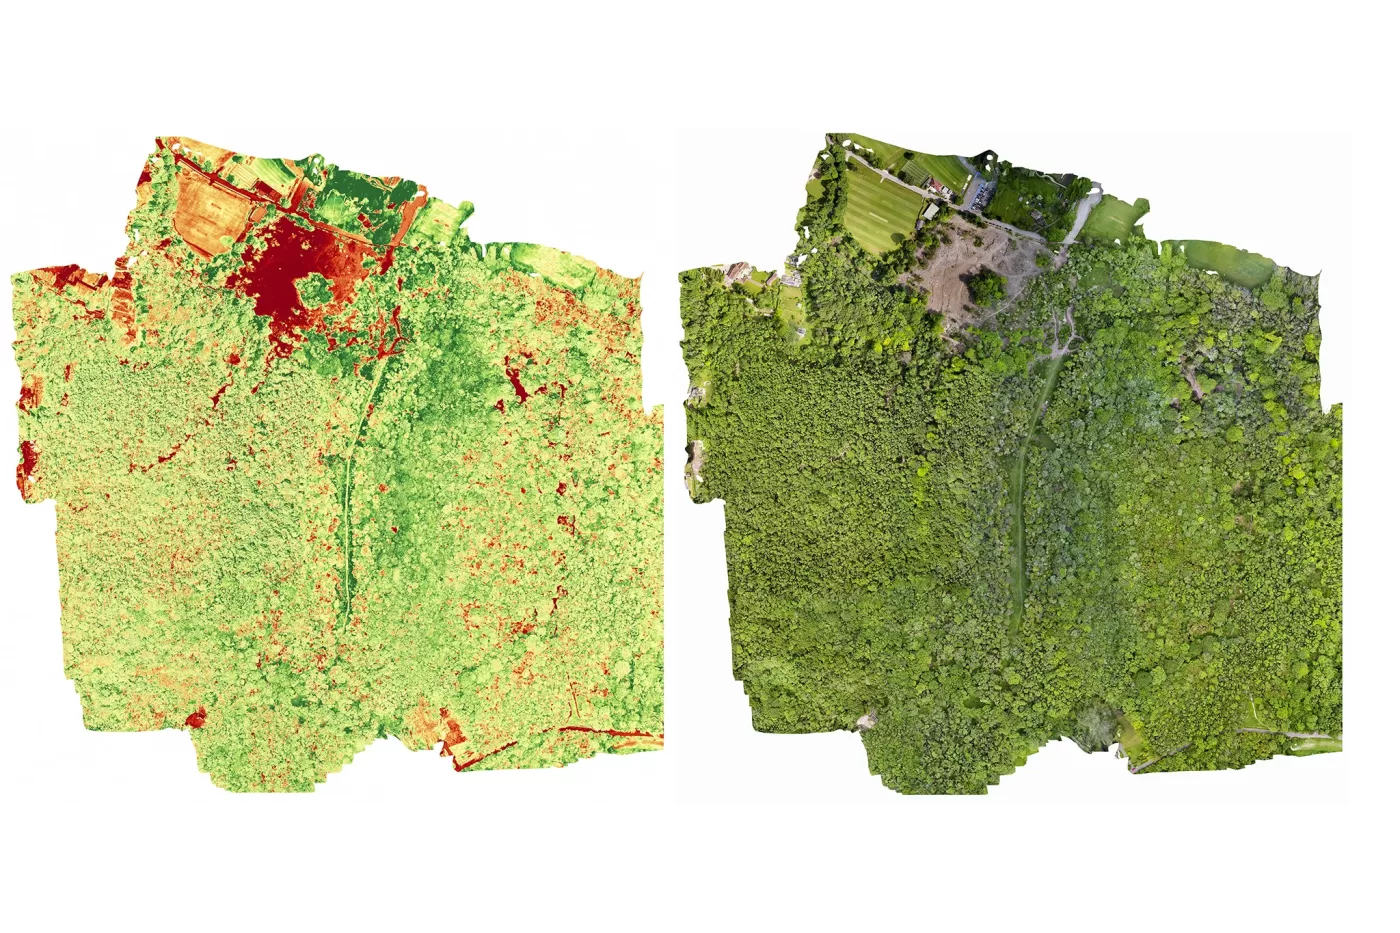
From directly above, the whole block is one image. Every crown is visible at once, at a resolution where individual trees can be picked out, and the pattern that is invisible from a track becomes obvious: which compartments are thinning, where the decline is spreading from, and how much of the canopy is genuinely gone. Fly it again to the same specification a season or a year later and the difference between the two is a measurement rather than an impression, which is what turns a survey into a management tool.
What the Survey Gives You
Products, and the decisions they support
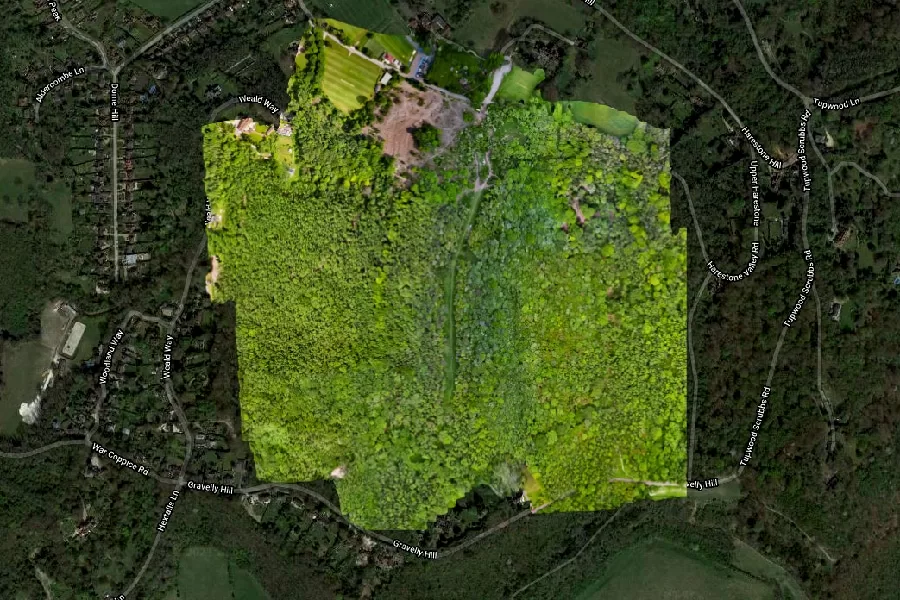
The core deliverable is a georeferenced orthomosaic of the canopy: the whole block as a single corrected image, measurable, at a resolution where individual crowns are identifiable rather than merely visible. It drops straight into GIS alongside your compartment boundaries, and it is the layer everything else is read against.
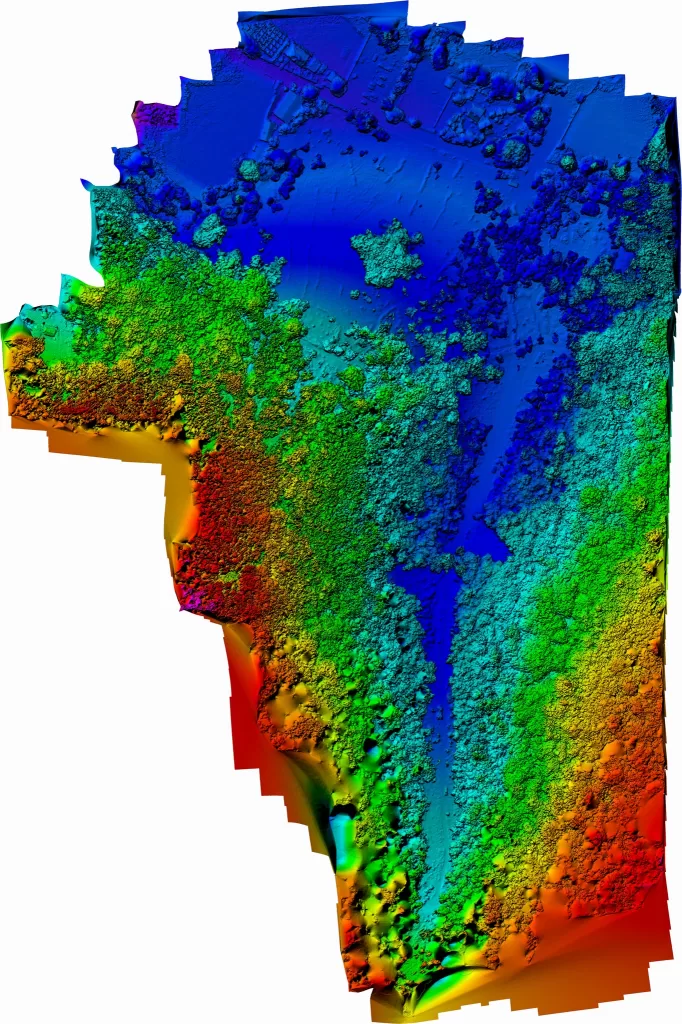
With it comes a canopy surface model from the same flight, a height map of the top of the wood. That gives canopy height and structure across the block, shows where the canopy is broken or thinning, and makes the difference between a full crown and a failing one measurable rather than a matter of opinion.
What those two things get used for, in practice: locating and tracking the spread of canopy decline; identifying which compartments need attention first; planning a felling operation and, just as usefully, the extraction routes and contractor access before anybody brings machinery onto soft ground; recording exactly what was taken out afterwards; and giving replanting and habitat recovery a real baseline to be measured against.
Deliverables are supplied in the coordinate system you work in, with a lightweight working copy alongside the full-resolution master so it opens on an ordinary machine rather than a workstation. Everyone involved, the estate, the consultant, the contractor and the funder, is then arguing from the same picture.
At a glance
What a canopy survey shows, what it is used for, and the one thing it cannot do.
- A measured image of the whole canopy from directly above, at a resolution where individual crowns are identifiable, across blocks that would take days to walk.
- A canopy surface model from the same flight, giving canopy height and structure, and the extent and pattern of thinning or loss.
- Repeatable. Flown again to the same specification, so change between visits is attributable to the wood rather than to the weather or the season.
- Used for disease spread and canopy decline, felling and extraction planning, the post-works record, replanting strategy and habitat recovery.
- The honest limit: it maps the canopy, not the ground beneath it. Photogrammetry can only see what the camera can see, so there is no bare-earth model under closed canopy. That is a LiDAR survey.
- DMI supplies the data. The arboricultural and ecological assessment stays with your own consultants, who work from it.
The strongest use is comparison: a survey before the work and another afterwards, flown identically.
Often Flown on the Same Estate
Before and After: the Survey That Earns Its Money Twice
Plan the operation with it, then evidence what was done
Where a wood has to be worked, whether that is disease-driven felling, thinning or storm clearance, one survey does two quite different jobs and the second one is usually the unexpected value.
The pre-works survey is a planning document. It shows where the decline actually is rather than where it was reported to be, which compartments are urgent, and how much canopy is involved. It also shows the things that decide the cost of the operation: where the ground is open enough to get machinery in, which routes work for extraction, where the stacking areas can go, and what is going to be difficult. Those decisions get made on a picture instead of on a walkover, and they get made before the contractor prices the job.
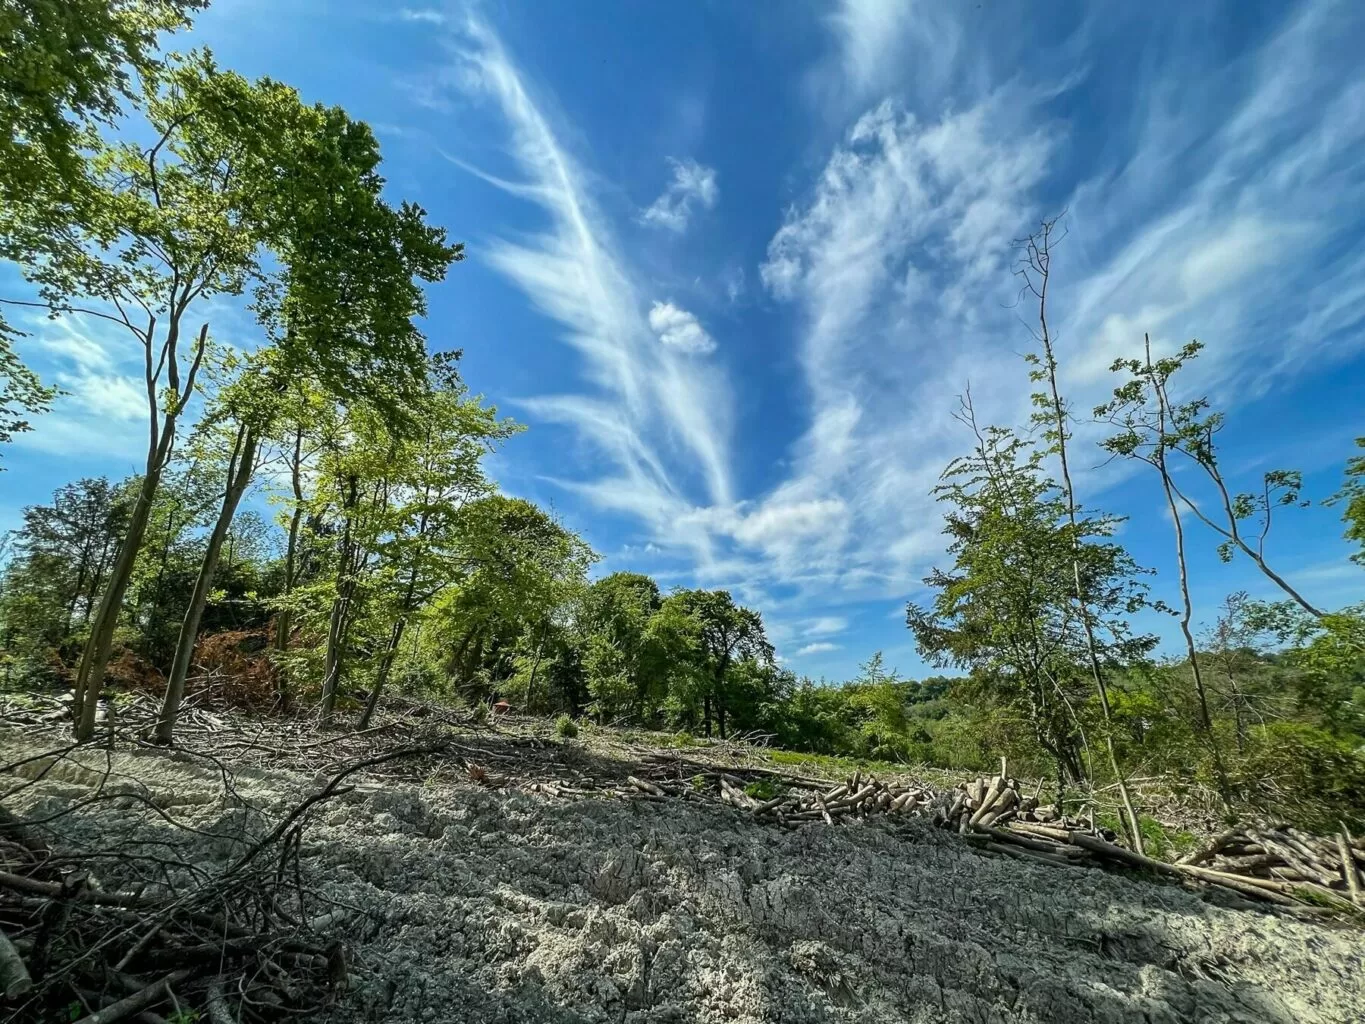
The post-works survey is the record. Flown to the same specification once the work is finished, it documents exactly what came out and what is left, across the whole block, on a dated and measurable image. That matters more than it sounds: it settles what was actually done, it evidences compliance for whoever needs it, and it is the baseline that replanting and recovery are measured from for years afterwards.
The pair together is what makes either of them worth much. A single map tells you what a wood looks like today. Two identical maps tell you what has changed and by how much, and that is the question estates, consultants and funders are actually asking. Flown the same way both times, the difference between them is a measurement rather than two impressions taken a year apart.
A Hundred Acres of Diseased Woodland, Mapped Before and After Felling
A hundred acres of woodland surveyed after widespread tree disease forced a major felling operation. The pre-clearance mapping showed the pattern of canopy decline and let extraction routes and contractor access be planned properly. Once the diseased trees were out, the block was flown again to produce a post-clearance record of every area of felling and the new terrain profile, which now supports replanting and habitat recovery.
What It Can See, and What It Cannot
Being straight about the limits is more useful than a longer capability list, because in forestry the limits are the thing most likely to be misunderstood at the point of ordering.
It maps the canopy, not the ground beneath it. Photogrammetry builds its model from what the camera can see, and through a closed canopy the camera sees leaves. There is no bare-earth terrain model under a wood in leaf, and any that is produced there is an interpolation between the few gaps rather than a measurement. If your question is about ground levels under trees, that is a LiDAR survey, and we will say so at the enquiry rather than at delivery.
It shows condition, it does not diagnose it. The survey makes crown thinning, dieback patterns and canopy loss visible and measurable across a whole block, which is exactly the evidence an arboricultural or ecological consultant needs and cannot easily gather. The assessment itself stays with them. DMI provides survey, mapping and reporting; it does not offer an arboricultural opinion, a tree safety assessment or an ecological determination, and it would not be worth having if it did.
It does not see under the canopy at all. Understorey, deadwood on the floor, stem condition, root plates and anything at ground level are invisible from above. A canopy survey is a complement to walking the wood, not a substitute for it, and the best use of it is deciding where to walk.
What it does exceptionally well is scale and repeatability. A hundred acres in a day, every crown seen from directly overhead, and the ability to do it again identically. On a block that is being managed over years rather than months, that combination is difficult to get any other way.
In most kinds of mapping the date of the flight is a scheduling question. In woodland it is a specification question, because the wood is a different object in June from the one it is in November.
Leaf-on, through the growing season, is what you want for canopy condition. A full crown and a failing one look obviously different, thinning shows as light coming through where it should not, and the canopy surface model describes a real, closed canopy. It is the right condition for disease assessment and for measuring cover.
Leaf-off, in winter, shows you the structure instead: stems, branch architecture, the shape of the wood, and considerably more of the ground between the trees. It is better for seeing what is physically there and for planning access, and worse for anything about crown health.
The trap is in comparing the two. Fly a wood in July, fly it again the following March, and the canopy will have “lost” an enormous amount, none of which is disease. The measurement is real and the conclusion is nonsense. Seasonal change will comfortably outweigh the signal you are looking for, and the same applies at a smaller scale to sun angle, cloud and time of day, which change how the canopy reads.
So a repeat survey is booked to a window, not to a date. The specification fixed at the first visit records the season, the conditions and the flight parameters, and the return visit reproduces them. It occasionally means waiting a few weeks for the right conditions rather than flying when the diary suits. That is the difference between two surveys you can subtract from one another and two you cannot.
- Mapping deliverables are supplied georeferenced, on British National Grid (EPSG:27700) using the Ordnance Survey OSTN15 transformation, or in a stated local system where a national grid position is not required.
- Repeat surveys are flown to the specification fixed at the first visit, including the seasonal window, so that change measured between visits is attributable to the woodland rather than to the season or the conditions.
- Canopy products describe the upper surface of the woodland. No bare-earth terrain model is produced or implied beneath closed canopy, because photogrammetry models only what the camera can see.
- Flight operations are conducted under a Civil Aviation Authority Operational Authorisation held against the PDRA-01 standard scenario, with a General VLOS Certificate (GVC) and an A2 Certificate of Competency.
- Drone Media Imaging provides survey, mapping and reporting services. No arboricultural, tree safety or ecological assessment is offered or implied, and no chartered surveying designation is held.
Tell Us the Block and What You Are Trying to Settle
Send us the location and rough area of the block, and what the survey has to help you decide: disease spread, a felling operation, a post-works record, or a baseline to measure recovery against. You will get a fixed price back with the deliverables written into it in plain words, and an honest answer about anything a canopy survey cannot tell you. If a repeat visit is likely, say so now, because the seasonal window is worth fixing at the first flight rather than the second.