
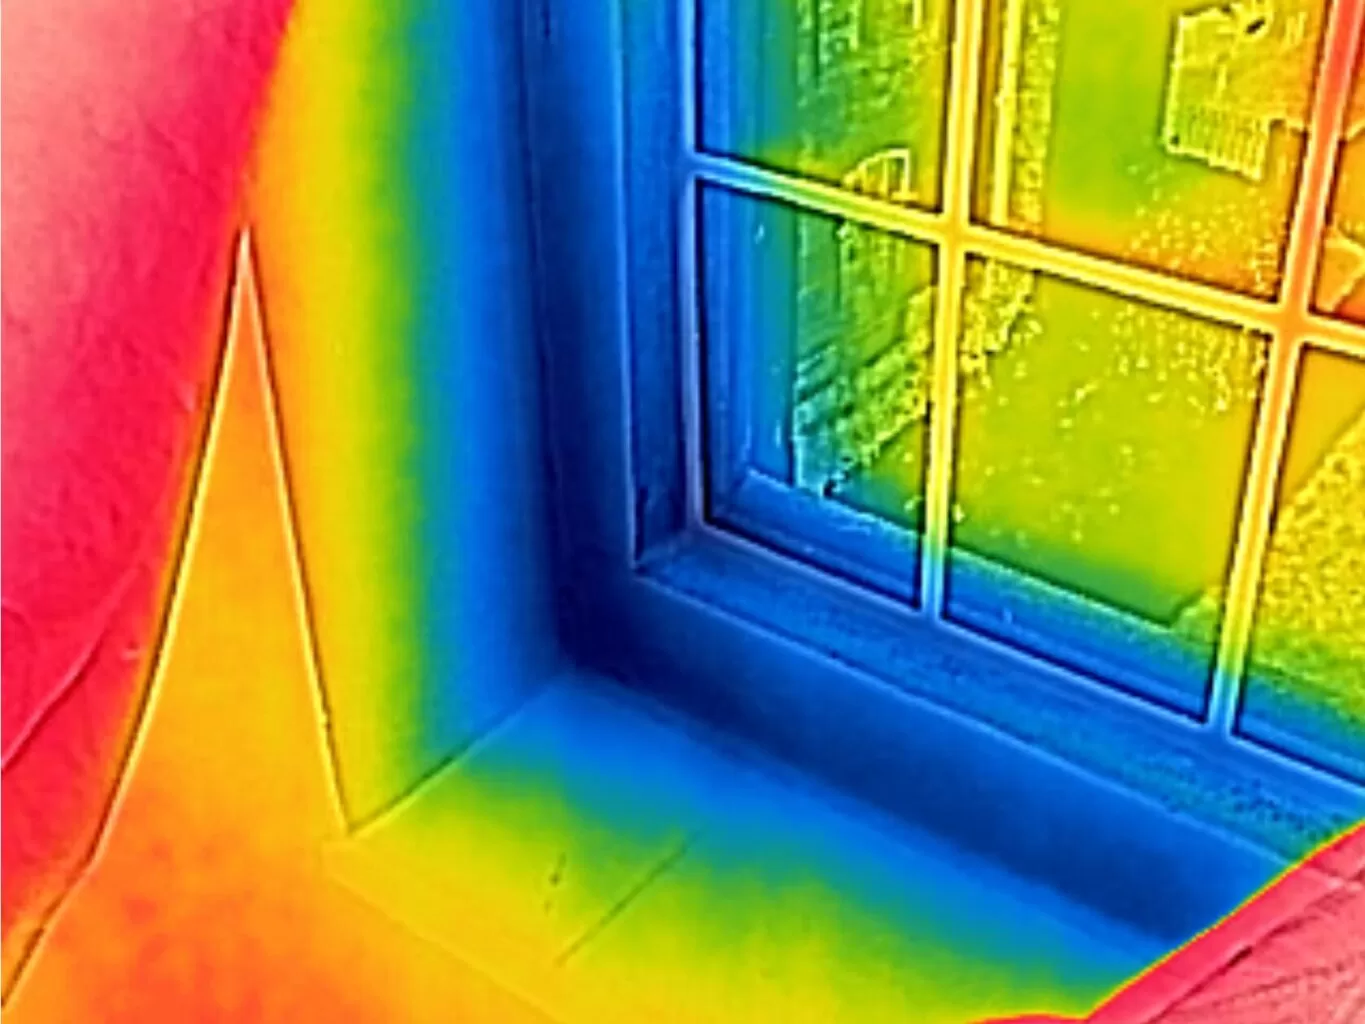
Thermal Imaging Colour Palettes


Thermal cameras don’t actually detect colour at all as they operate outside of the range of visible light, but the thermal info is recorded and displayed in colour formats to make it easier to interpret.
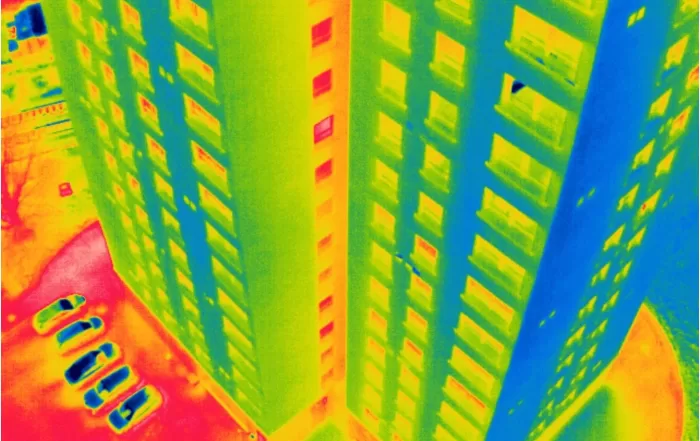
The most common palette is the so-called Iron one where black represents the colder areas through red, orange and yellow the mid-range temperatures and white for the hottest points. Each images also includes a scale with the colours and the temperature ranges they denote although the digital images will allow you to take a precise temperature reading at almost pixel level.
Another common palette is the grey scale one, again with black areas being cooler and white areas showing the hottest parts. It can be harder for the human eye to detect the difference between shades of grey so it’s less commonly used for that reason but some programs do require this format.
Thermal images from our state of the art camera offer a a variety of colour palettes for your images. This allows us to provide you with your images or video footage in a palette that is familiar to you and your inspection program. So whether you prefer the detail offered by a multi colour palette, or the simplicity of the grey scale, we can offer a service to suit.

Photogrammetry For Roof inspections, Solar Panels, and Hard-To-Reach Assets: A Technical Approach
Photogrammetry for roofs, solar panels, and complex vertical structures requires far more precision than standard terrain mapping. This post from explores why traditional workflows fall short and how operators can use tools such as terrain-following, custom camera profiles, circlegrammetry, and automated vertical scanning to achieve consistent results. Packed with real-world examples and scientific validation, it provides a practical technical guide to improving model accuracy, mission repeatability, and inspection efficiency across challenging commercial environments.Capturing quality photogrammetry data from vertical and elevated structures remains one of the trickier challenges in commercial drone operations. Traditional surveying workflows fail here. Kristaps Brass, Product Owner at UgCS, has spent years working with operators who tackle these missions daily. Solar farms, building facades, communication towers, dam inspections. The pattern is consistent: manual flying burns time and money, and processed models show gaps where critical details should be. This article covers what actually works, based on field-tested methods and real operator feedback.

IEC 62446 Solar String Testing Now Available
Drone Media Imaging now offers certified IEC 62446-compliant solar string testing, delivering complete electrical diagnostics for commercial PV systems. This new service verifies string integrity, insulation, voltage, current, and performance using advanced I-V curve tracing and Fill Factor analysis. Ideal for commissioning, troubleshooting, and maintenance, our testing supports safety, compliance, and ROI assurance. Combined with thermal imaging, we offer a powerful dual-inspection approach. Book today to ensure your solar array is operating safely, efficiently, and within international performance standards.
Level 3 Thermography Reporting Project – 3 Multi-Storey Residential Blocks
We supported a large thermal inspection project across three residential buildings by providing certified Level 3 thermographic reporting based on drone data collected by the client. Using a protocol we developed, they captured radiometric thermal images, which we analysed remotely to identify heat loss, glazing issues, and roof moisture indicators. This collaborative approach showcases how our clients can carry out surveys independently, while we deliver professional-grade thermographic interpretation and reporting — cost-effectively and without needing site access.
Drone Services Enquiry
Thermography | Inspections | Solar | Photogrammetry
Discover how drone technology can enhance your operations with a free quotation from our experts. Get a Free Quote or Make an Enquiry Today!
related posts
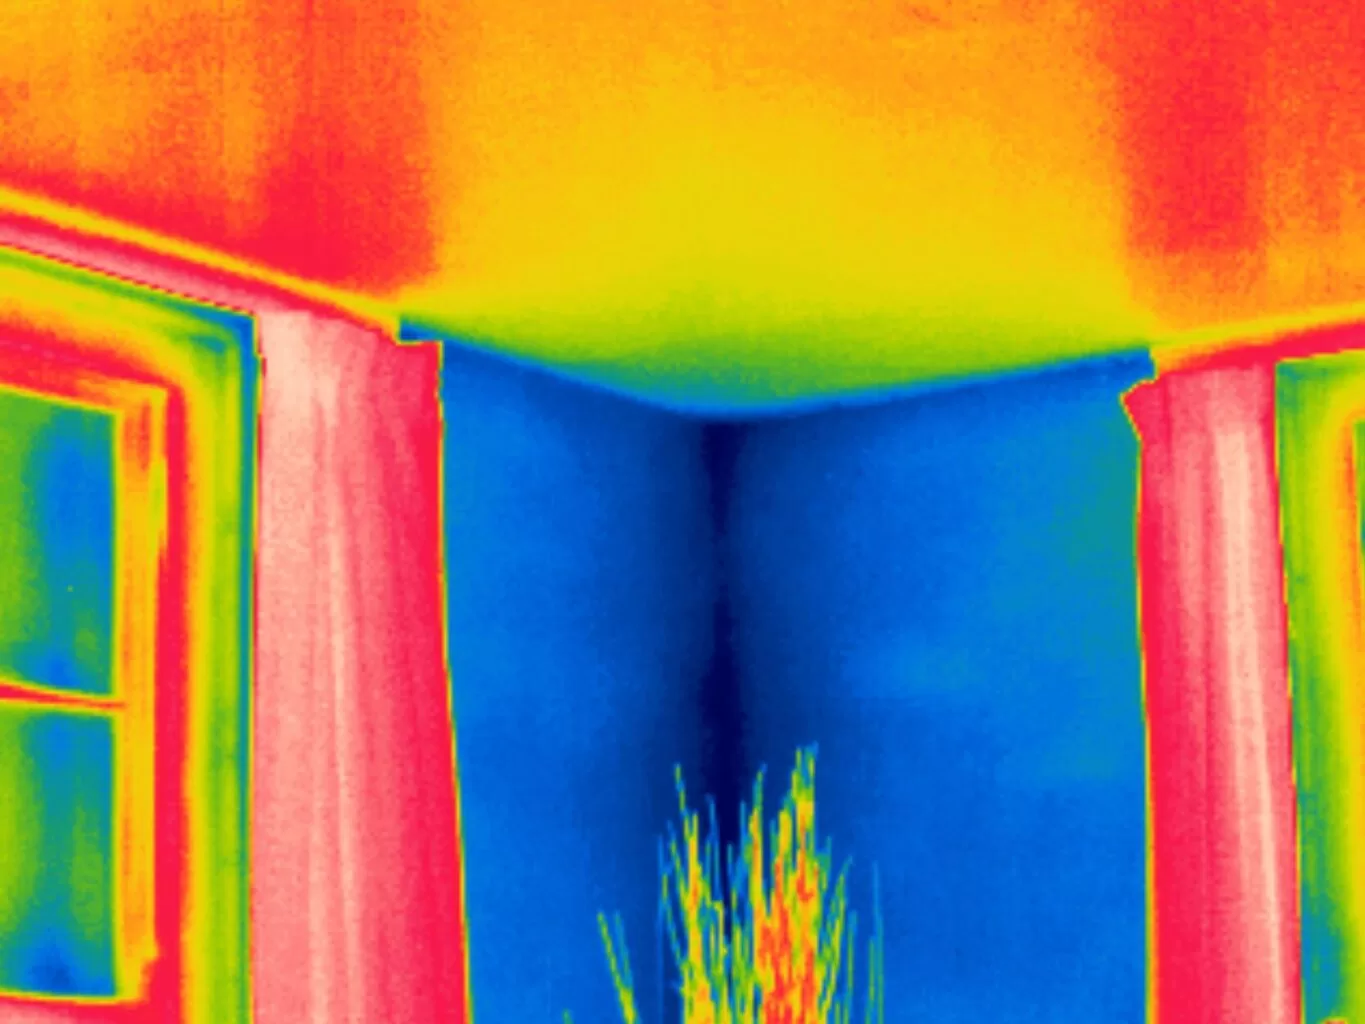
Discover the effects of thermal convection on building room corners with insights from thermal imaging. Uncover hidden insights.
As winter's chill recedes, the optimal period for building thermography is ending. This technology relies on temperature differences to detect energy inefficiencies. With spring's arrival, these disparities diminish, making it harder to identify problem areas. Act now to ensure your building's energy efficiency before the seasonal window closes.