Aerial Solar PV Thermographic Inspection, Commercial Rooftop, East Midlands

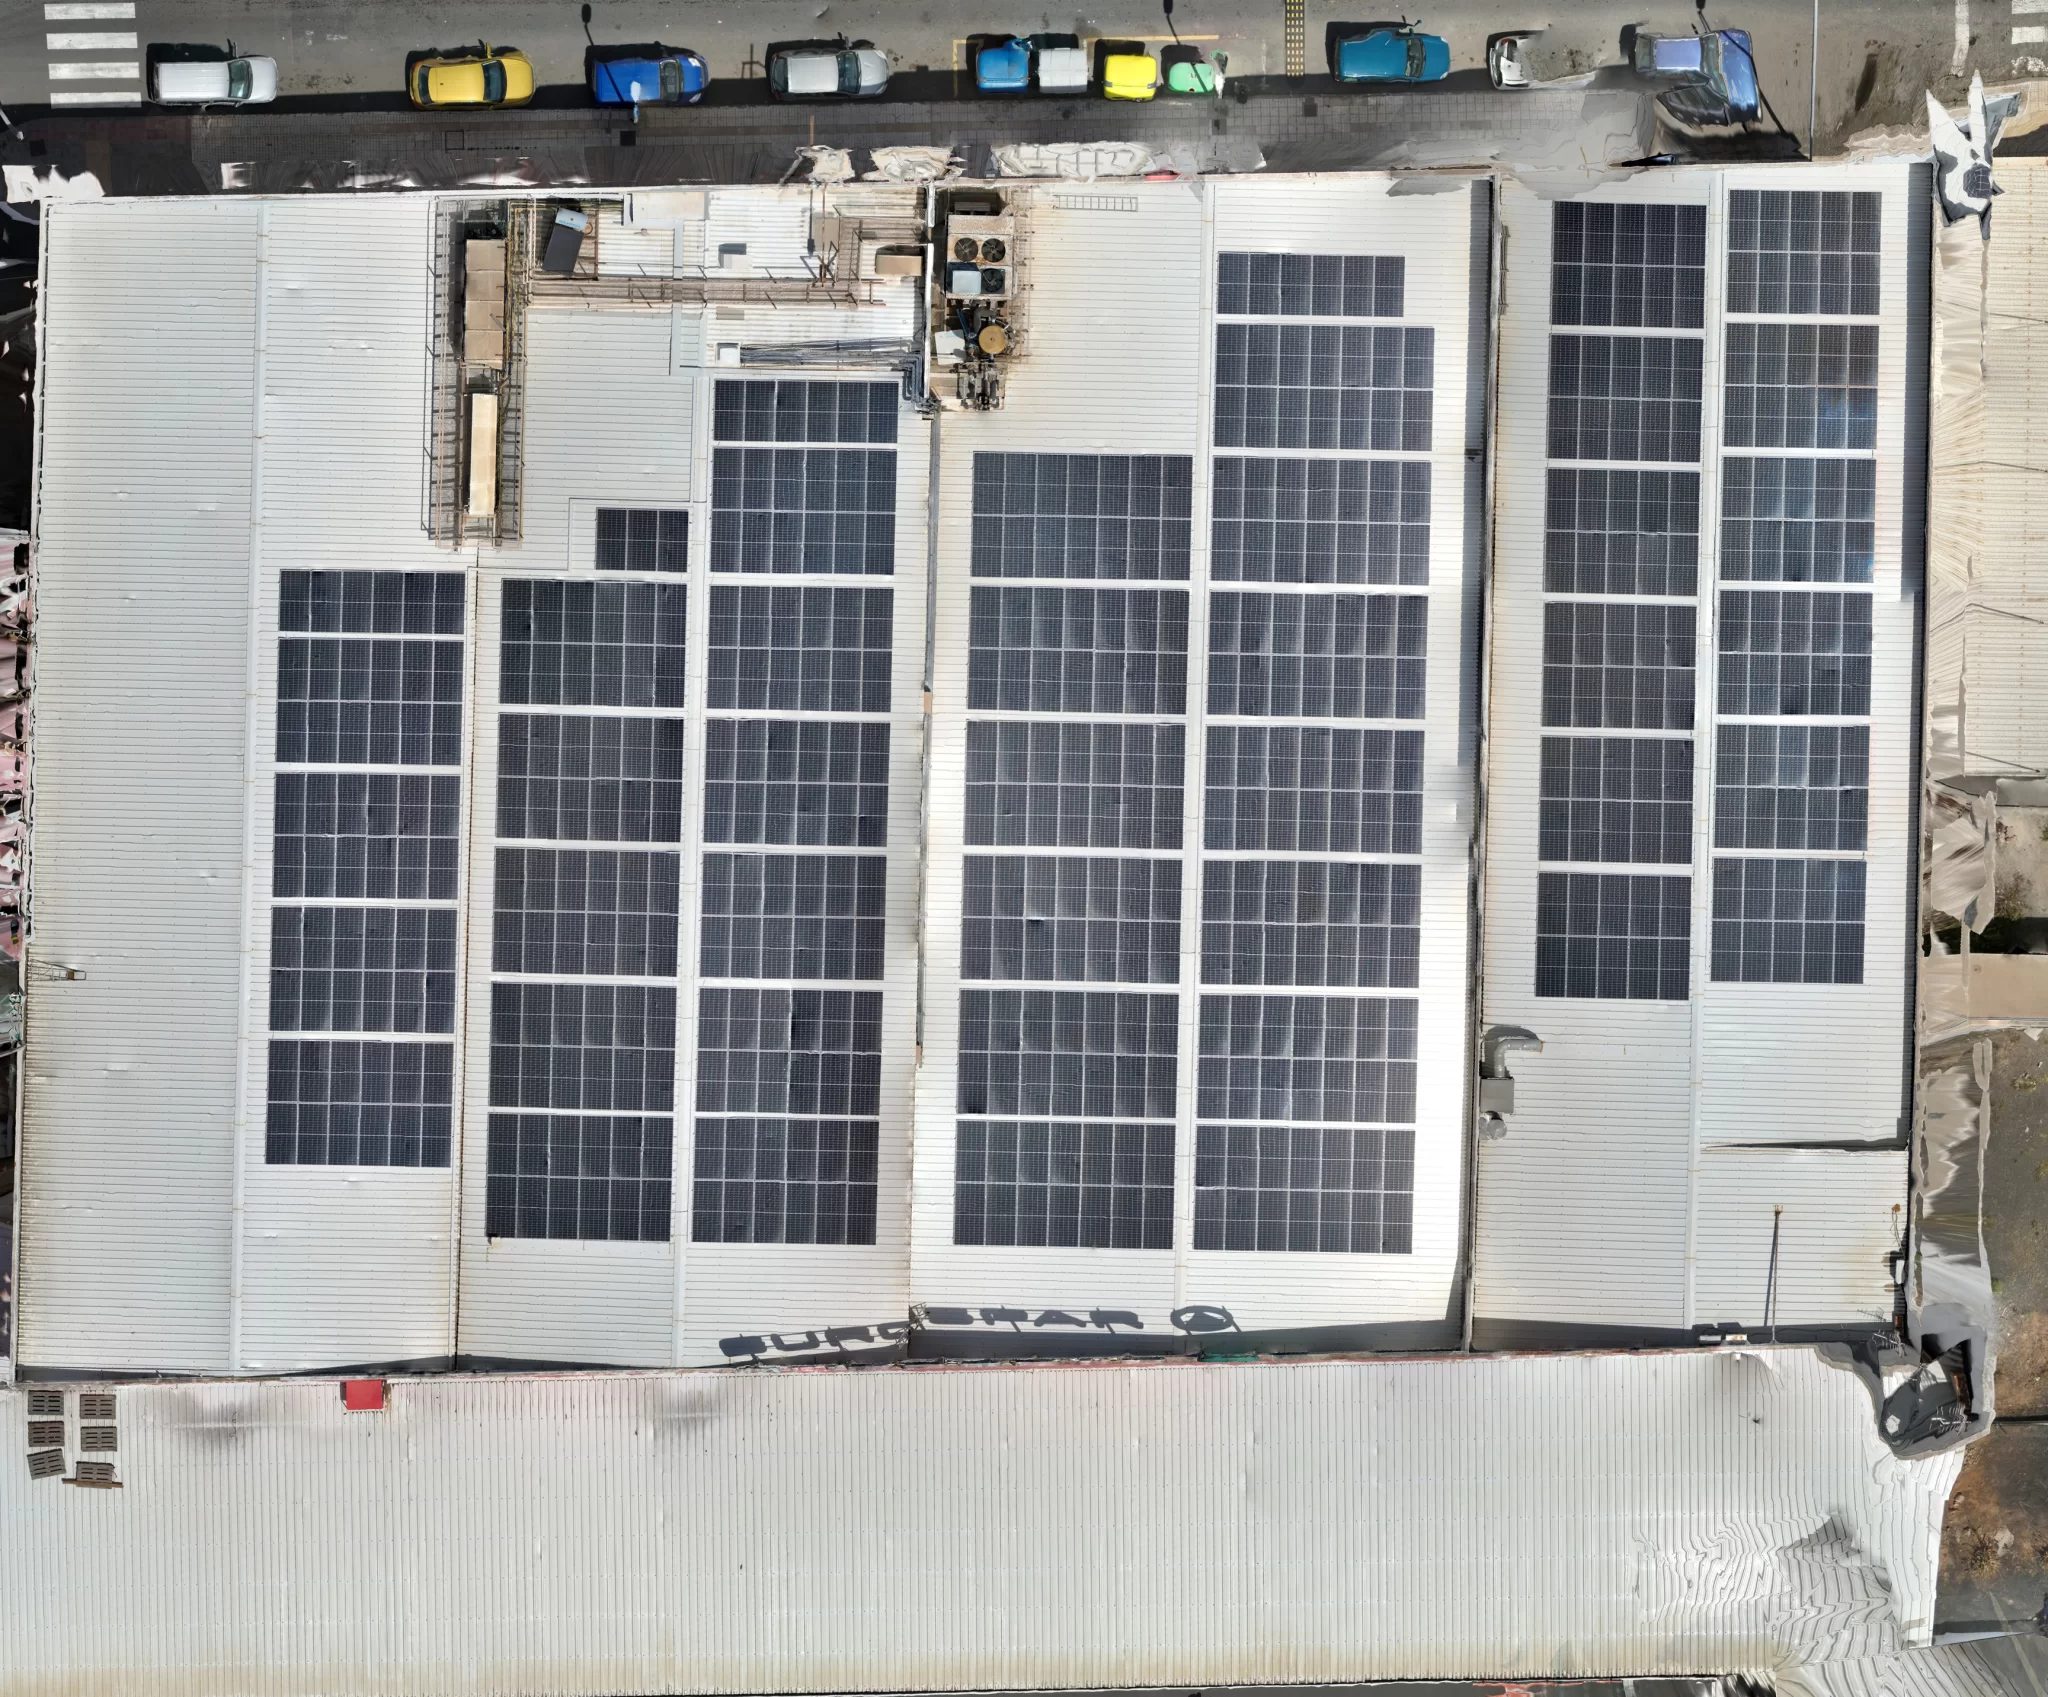
Drone Media Imaging carried out an aerial thermographic inspection of a commercial rooftop PV installation in the East Midlands under IEC 62446-3:2017, identifying twelve anomalies across a 464 kW, 2,006-module array. With no commissioning record or module data available, every finding was assessed by peer-group comparison against a thermogram-specific baseline, a recognised and defensible approach where reference documentation is absent. The most significant findings were two strings presenting a checkerboard thermal profile, alternating elevated and near-baseline modules along the string, consistent with a reverse-polarity or anti-parallel string connection.
These two strings lay in physically separated areas of the array, a distribution more indicative of a systematic wiring condition replicated at installation than a single localised fault, and both were classified at Medium severity with a Yield and Degradation Trajectory consequence. Eight further strings showed modest, broadly uniform Low-severity elevations, and two bypass diode locations showed early-stage developing signatures entered as a progression baseline. Our Level 3 Master Thermographer classified and reported every finding under the IEC 62446-3:2017 framework, providing the client with a prioritised investigation roadmap and a certified baseline for future inspections.
Project Overview
Subject
commercial rooftop solar PV inspection, IEC 62446-3 solar thermography, aerial solar thermal survey East Midlands, reverse polarity PV fault detection, checkerboard thermal profile solar string
Skills Used
IEC 62446-3 solar thermographic inspection, delta-T assessment, qualitative thermal analysis
Portfolio Tags
solar PV inspection, commercial rooftop solar, IEC 62446-3, aerial thermography, reverse polarity solar fault, East Midlands drone survey, Drone Media Imaging, what causes a checkerboard pattern in solar panels
What causes a checkerboard pattern in solar panel thermography, Commercial rooftop solar PV thermographic inspection East Midlands UK, How to detect reverse polarity in a solar string without electrical testingWhat causes a checkerboard pattern in solar panel thermography, Commercial rooftop solar PV thermographic inspection East Midlands UK, How to detect reverse polarity in a solar string without electrical testing
Commercial Rooftop Solar PV Inspection: Checkerboard Fault Analysis, East Midlands
~ Some faults reveal themselves in patterns. Level 3 thermography is trained to read them. ~
Governing Standards
Standards and Governance
- IEC 62446-3:2017 governs the thermographic inspection of photovoltaic modules and arrays, defining survey conditions, anomaly categories, and reporting requirements for solar PV thermal surveys. This inspection was conducted as a simplified qualitative thermographic survey under this standard.
- ISO 18436-7 defines the training and certification requirements for thermographic condition monitoring personnel. All analysis, classification, and reporting for this inspection was carried out under Level 3 certification awarded in accordance with this standard.
- ISO 9712 sets the general framework for the qualification and certification of non-destructive testing personnel, underpinning the thermographer qualification applied to this inspection.


How a checkerboard thermal profile points toward a reverse polarity fault, and why finding it twice across the same roof matters, reviewed and certified at Level 3 under IEC 62446-3:2017
Aerial Thermographic Inspection of a Commercial Rooftop Solar Array, East Midlands
When two strings on a commercial rooftop solar installation present identical thermal profiles in physically separate parts of the array, that spatial pattern is itself a diagnostic clue. A checkerboard signature, alternating hot and cool modules along a single string with no shading or soiling to explain it, is one of the more distinctive anomaly types in solar PV thermography, and finding it twice on the same roof shifts the probability firmly toward a systematic cause rather than a random localised fault.
Drone Media Imaging was commissioned to carry out a full aerial thermographic inspection of a 464 kW commercial rooftop installation in the East Midlands, surveying all 2,006 modules under conditions compliant with IEC 62446-3:2017. No commissioning record, module specification, or string layout diagram was available, making peer-group comparison the sole classification method throughout. What follows is how the survey was carried out, what it found, and what the asset owner can now do about it.
Reverse Polarity Profile Detected: Commercial Rooftop Solar PV Inspection, East Midlands
Diagnosing a 464 kW Commercial Rooftop Array Without a Commissioning Record
Large-scale commercial rooftop solar installations are frequently inspected years into operation, when the original commissioning paperwork has changed hands, been archived, or simply never existed in a retrievable form. That absence of reference data is not unusual, but it raises the analytical stakes considerably: every finding must be assessed entirely by comparison with its peers within the same thermogram, with no module datasheet, no string diagram, and no baseline electrical installation certificate to anchor the assessment. Peer-group comparison is a recognised and IEC-compliant method in these circumstances, but it demands more from the Level 3 analyst, not less.
This was the situation when Drone Media Imaging was commissioned to inspect a 464 kW commercial rooftop installation in the East Midlands in May 2026. The array, covering a single roof zone with approximately 2,006 modules at the time of survey, had no available commissioning record, no module specification, and no string-to-roof layout diagram. A physical count from the RGB aerial imagery suggested that approximately 16 modules had been removed from the original installed count of around 2,022 over the installation’s operational life, a detail noted in the findings but one that did not alter the thermographic analysis.
The inspection was commissioned to support the asset owner’s ongoing performance and maintenance programme. At a scale of 464 kW, even a modest cluster of string-level anomalies represents a measurable aggregate yield reduction, and the absence of inverter monitoring data or historical fault records makes a periodic thermographic survey one of the few reliable methods for identifying electrical conditions that are not producing outright failure. Drone Media Imaging conducted the aerial survey under IEC 62446-3:2017 compliant conditions and delivered a Level 3 certified findings report.

How was the aerial thermographic inspection of the commercial rooftop carried out?
The survey was conducted by remotely piloted aircraft during a suitable window in May 2026, with environmental conditions monitored throughout using a calibrated weather meter and a compliant solar irradiance meter. Solar irradiance exceeded 600 W/m² throughout the capture window, rising to 882 W/m² by the close of the session. Wind averaged well below the 7 m/s threshold specified by IEC 62446-3:2017, sky conditions were effectively clear, and the survey was completed within the near-solar-noon window required by the standard. Radiometric parameters, including emissivity, reflected apparent temperature, atmospheric temperature, relative humidity, and instrument-to-target distance, were set and applied consistently across all captured thermograms.
The array was surveyed as a single zone using a radiometric thermal camera mounted on an aerial platform operating at a consistent altitude above the module surface. Ground sample distance was maintained at 3 cm across the full array footprint, providing the spatial resolution needed to resolve individual modules and identify sub-module thermal features reliably. As no string layout, module data, or commissioning baseline was available, the inspection was thermal only, with all findings classified by peer-group comparison against thermogram-specific EL1 baselines drawn from clean, uniformly irradiated modules in the same thermogram.
The scope included and excluded the following:
- Included: full thermal survey of all 2,006 modules across the single roof zone
- Included: IEC 62446-3:2017 severity classification with Level 3 review
- Included: Drone Media Imaging Consequence Classification, Safety, Yield and Degradation Trajectory, applied to every anomaly
- Included: full annotation of all detailed thermogram pages
- Excluded: electrical string testing, string-to-roof cable tracing, and intrusive investigation of any kind
What did the commercial rooftop solar PV inspection find?
Twelve anomalies were identified across the single roof zone, reviewed and classified by our Level 3 Master Thermographer under the IEC 62446-3:2017 severity framework. No finding reached the absolute temperatures associated with encapsulant degradation, bypass diode failure, or arc-fault risk, and no Safety consequence was triggered at survey.
The most notable findings were two strings presenting a checkerboard thermal profile: an alternating sequence of markedly elevated and near-baseline modules along the string, with peak temperatures reaching the mid-60s°C against EL1 baselines in the 47 to 49°C range, giving maximum temperature differentials of 14 to 18°C above EL1. Both were classified at Medium severity. In the absence of any shading, soiling, or physical cause, an alternating hot-and-cool pattern at module scale is consistent with a string-level electrical condition rather than a cellular defect. The most probable mechanism is a reverse-polarity or anti-parallel string connection, in which the affected modules sit in reverse bias and dissipate current drawn from their correctly-connected neighbours as heat rather than contributing to output. Crucially, the two strings sat in physically separated areas of the array, a distribution more consistent with a wiring condition replicated at commissioning than with a single localised fault that happened to present identically in two places.
Eight further strings showed modest, broadly uniform elevations at Low severity, with temperature differentials between 5.9°C and 9.0°C above EL1. These are consistent with minor string-level conditions such as a marginally raised series resistance, a developing connection at a joint or connector, or the string operating a little off its maximum power point relative to its peers. Two bypass diode locations showed early-stage developing signatures, marginal in magnitude, and were entered into the report as a progression baseline for comparison at the next inspection interval.
What did the inspection deliver for the commercial rooftop owner?
The inspection delivered a Level 3 certified thermographic report under IEC 62446-3:2017, covering all twelve anomalies with individual classification, thermogram-referenced annotation, and a four-column findings table. The two strings consistent with reverse polarity carry both the greatest yield impact and a progressive damage mechanism: sustained reverse current stresses module interconnects and bypass diodes over time, and the thermal signature observed at survey is indicative of a condition that may deepen at the next inspection interval without intervention. A suitably qualified electrical contractor should investigate these strings to confirm the root cause and determine the remedial action required.
The asset owner now holds:
- A certified thermal baseline for all 2,006 modules, against which future inspections can measure any change
- A prioritised investigation roadmap with the two reverse-polarity strings identified for first attention
- Classified records for the eight Low-severity strings and two developing diode anomalies, supporting a proportionate monitoring approach
- A compliant IEC 62446-3:2017 inspection record to support asset management, performance reporting, and due diligence documentation
The eight Low-severity strings and two developing diode signatures are well suited to the installation’s routine performance-management programme. Their individual magnitudes are modest, but the aggregate yield reduction across a 464 kW system from ten string-level findings is commercially significant, and the periodic thermographic record provides the data to track any change.
What made this commercial rooftop solar inspection stand out?
The checkerboard pattern was the defining diagnostic feature of the survey. Identifying the same thermal signature on two physically separate strings, with no commissioning data, no module specification, and no string diagram available to cross-reference against, required a differential diagnosis that thermography alone cannot fully resolve. The thermal evidence points clearly toward a systematic wiring condition, but distinguishing reverse polarity from an anti-parallel connection or an open-circuit isolation requires string-level electrical testing. This survey illustrates clearly where thermography defines the investigation scope for the contractor, rather than replacing it.
Book a Solar PV Thermographic Inspection
Drone Media Imaging delivers IEC 62446-3:2017 compliant aerial thermographic inspections of photovoltaic installations of all sizes, with all analysis, classification, and reporting carried out by our Level 3 Master Thermographer. We serve clients primarily across Sussex, Hampshire, Kent and Surrey, and travel throughout the UK, Ireland and Europe for commercial-scale projects. To discuss your inspection requirements or request a quote, get in touch with the team.